US Jobs Report Today
....................................................................................................................


Good morning!
Wall Street is treading cautiously this Friday morning, with stock futures mixed as traders hold their breath for the official July employment report.
Markets are showing a split open heading into the bell. Nasdaq futures are leading with a 0.5% gain, while Dow and S&P 500 futures are hovering near the flatline. Investors are looking to build on recent highs, but nobody is making aggressive bets until the Federal Reserve gets its latest labor market update.
All eyes are on the July Jobs Report at 8:30 a.m. ET. Wall Street is hyper-focused on the U.S. Labor Department's Nonfarm Payrolls release. Consensus estimates expect the economy to have added roughly 80,000 jobs in July, with the unemployment rate holding steady at 4.2%. While massive AI capital expenditures and inflation numbers have dominated headlines recently, today's print serves as a critical input for the Federal Reserve as officials debate whether another interest rate hike is needed at their upcoming meeting.
No peace deal yet as Strait of Hormuz flare-ups push oil higher. Energy markets remain volatile as diplomatic efforts stall. Reports of explosions linked to Iranian interceptions of "hostile targets" near the Strait of Hormuz have renewed anxieties over maritime shipping lanes. While talks involving Oman continue behind the scenes, threats that Iran may attempt to restrict U.S. and Israeli vessels are keeping crude prices supported, which could spill over into inflation expectations and Treasury yields.
Earnings wrap up a busy week. Following massive reports from megacap tech and energy heavyweights, Friday's corporate calendar cools down with updates from nuclear power developer Oklo (OKLO), energy provider Vistra (VST), apparel brand Under Armour (UA), and fast-food chain Wendy's (WEN).
It's a "wait-and-see" Friday morning. If the jobs report delivers a balanced number without major inflation surprises, tech could extend its weekly gains—but geopolitical headlines in the Gulf remain a wild card.

📊 S&P 500 Futures Hold Steady Ahead of Jobs Report
U.S. stock index futures traded mixed early Friday as Wall Street awaited the July nonfarm payrolls release. Nasdaq-100 futures added 0.32% while S&P 500 contracts edged up 0.1%, counterbalancing a minor slip in Dow futures following a 460-point pullback for the blue-chip index. Premarket sentiment got a boost from earnings, with Airbnb jumping over 8% and Cloudflare surging 16% on upbeat guidance.
📈 BofA Gauge Hits Most Extreme Bullishness Since 2021
Bank of America strategists warned institutional clients to begin trimming risk exposure as investor bullishness reached its most extreme level since 2021. According to the firm's proprietary sentiment indicator, stretched positioning and rampant optimism across equities have left risk assets increasingly vulnerable to unexpected shocks.
🛢️ Oil Extends Gains as Iran Targets Ships in Hormuz
Crude prices pushed higher after reports confirmed Iranian forces attacked targets in the Strait of Hormuz. The renewed maritime hostility follows efforts by Tehran to bar U.S. vessels from the critical energy passage via an arrangement with Oman, disrupting global shipping routes and injecting a fresh geopolitical risk premium into energy markets.
⚡ Asia's Power Grid Deficit Threatens Regional AI Ambitions
Industry experts warn that Asian economies must urgently deepen and modernize their power grids to sustain national AI masterplans. With the Strait of Hormuz remaining a vulnerable energy supply point and nations like Japan earmarking trillions of yen for AI and chip infrastructure, regional data centers risk running into severe grid bottlenecks.
💴 Yen Rally Unwinds a Week After Joint U.S.-Japan Intervention
The Japanese yen surrendered recent gains just a week after a joint U.S.-Japan currency intervention aimed at supporting the currency. Foreign exchange desks noted that structural fundamentals and shifting domestic policy expectations continue to weigh on the yen, keeping it under scrutiny despite official market support.
💻 SK Hynix Pledges $38B for Two Memory Mega-Plants
South Korean chipmaker SK Hynix announced a massive 54 trillion won ($38.1 billion) investment to build two new memory fabrication facilities in Yongin ("Y2") and Cheongju ("M17"). The capital deployment aims to alleviate severe high-bandwidth memory (HBM) supply shortages as global enterprise demand for AI hardware outpaces capacity.
🥇 PBOC Extends Gold Purchases to 21st Straight Month
The People's Bank of China added 640,000 ounces of gold to its official reserves in July, extending its buying streak to 21 consecutive months. China's bullion holdings reached 76.08 million ounces, reflecting an ongoing effort by the central bank to diversify foreign exchange assets amid persistent global financial volatility.

The Price You Remember Doesn't Matter
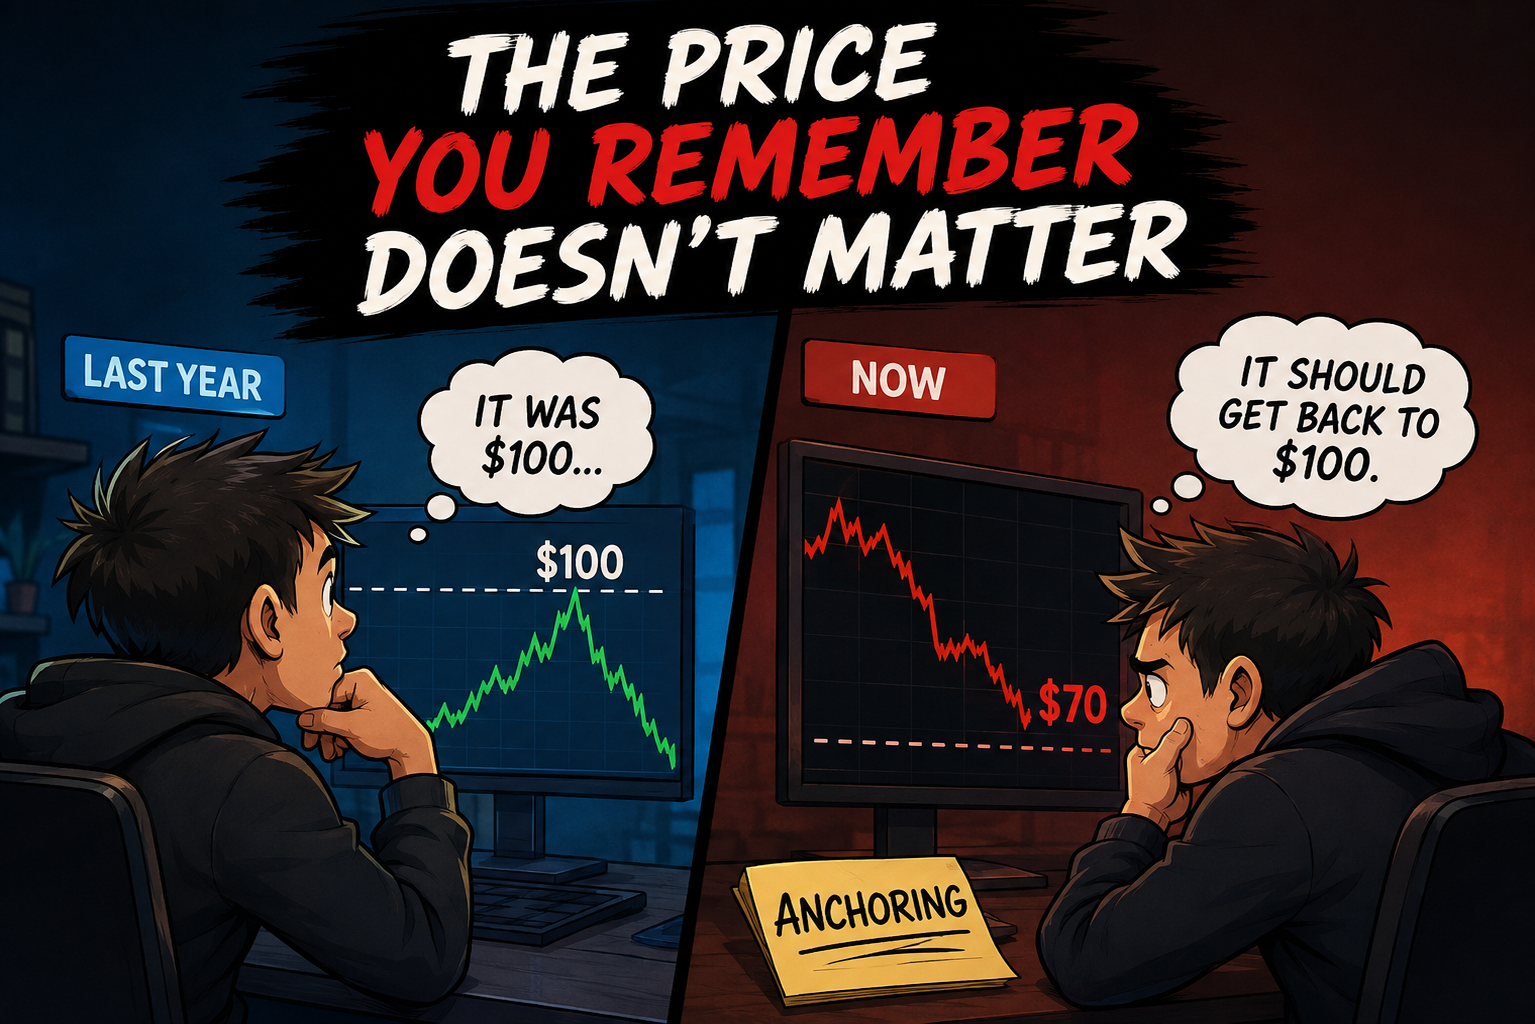
A stock traded at $100 last year.
Now it's at $70.
You look at the chart and think, "It should get back to $100."
But why?
Because you've seen that price before.
That's anchoring.
Traders often attach themselves to a previous price and treat it like a reference point for what the asset is "worth." They hold because they want to get back to breakeven. They avoid a trade because the price feels too high compared with where it used to be.
But the market doesn't know what price you remember.
A stock isn't cheap simply because it used to trade higher. And it isn't expensive simply because it has moved above a level you consider important.
Strong traders focus on current conditions. They look at price action, fundamentals, momentum, risk, and the setup in front of them—not an old number stuck in their head.
Because yesterday's price is information.
It isn't a promise.
When you stop anchoring to old levels, you can evaluate trades based on what the market is doing now.
Trade the market in front of you.
Not the market you remember.
Past prices can provide context, but they shouldn't make your decisions for you. Exploring different market perspectives can help you challenge assumptions and think more objectively.
You can explore a few market newsletters here:

ADX (Average Directional Index)
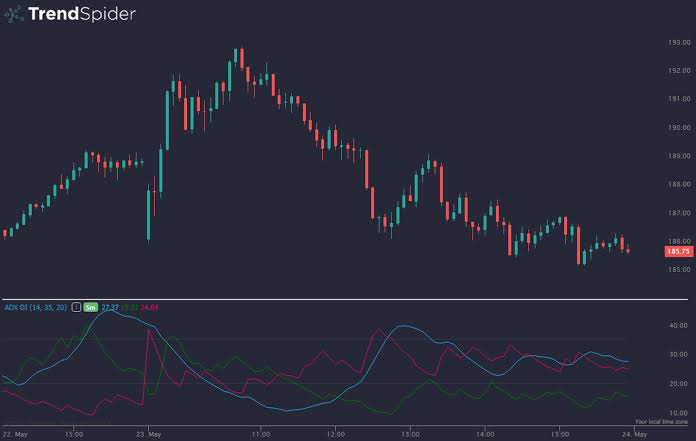
ADX Trend Strength Line with +DI and -DI. Source: TrendSpider The Average Directional Index (ADX) is a non-directional trend strength indicator developed by J. Welles Wilder. Moving on a scale from 0 to 100, the main ADX line answers one crucial question: How strong is the current trend? It is accompanied by two directional movement lines—+DI (Positive Directional Indicator) and -DI (Negative Directional Indicator)—which show whether the buyers or sellers are driving the momentum.
🔴 The Red Zone (ADX Below 20 / Weak Trend)
The Meaning: The main ADX line stays below 20. This indicates that the market is completely flat, choppy, or moving sideways in a range without any clear direction.
The Move: Stop trading trend-following strategies. Avoid breakout trades here, as fake-outs are extremely high. Focus on mean-reversion range strategies or stay on the sidelines until momentum picks up.
🟡 The Yellow Zone (ADX 20 to 25 / Building Momentum)
The Meaning: The ADX line crosses out of the choppy zone and travels between 20 and 25.
The Move: Watch closely. A trend is beginning to awaken. Use the +DI and -DI lines to identify which team is taking over: if +DI is above -DI, the bulls are taking charge; if -DI is above +DI, the bears are taking over.
🟢 The Green Zone (ADX Above 25 / Strong Trend)
The Meaning: The ADX line surges above 25 (and especially past 40 or 50). This confirms that a powerful, highly sustained trend is underway in the direction dictated by the DI lines.
The Move: Go! Ride the trend aggressively using moving averages or trailing stops. Note: ADX going up simply means strength—it rises during strong uptrends and during strong downtrends.
🔍 Two Simple Signals to Watch
1. The DI Crossover (+DI vs -DI)
Look at which directional line is on top when the ADX line breaks above 25.
- The Logic: A Buy Signal occurs when the +DI line crosses above the -DI line while ADX is rising past 25. A Sell/Short Signal triggers when the -DI line crosses above the +DI line while ADX is rising past 25.
2. The Trend Exhaustion Hook (ADX Above 40–50)
Watch for the main ADX line to reach an extreme height (above 40 or 50) and then hook downward.
- The Logic: When ADX reaches extremely high levels, the trend is becoming overextended. When the ADX line finally curves down from a high peak, it signals that the trend is losing velocity, making it time to lock in profits before a consolidation phase begins.
💡 The Simple Secret
Think of the main ADX line as the engine power gauge of a vehicle, regardless of whether the vehicle is driving forward (uptrend) or reversing in full gear (downtrend). A high ADX reading doesn't mean the price is high—it means the market has huge momentum behind its current movement. By combining the ADX engine gauge with the +DI/-DI steering wheel, you filter out noisy sideways markets and trade only when real momentum is present.

You Brought Yesterday's Loss Into Today's Trade
The market closes.
You shut your laptop.
Tell yourself,
"Tomorrow is a new day."
You get some sleep.
Wake up early.
Review your charts.
Have breakfast.
Everything feels... normal.
You think you've moved on.
Then your first setup appears.
It's a trade you would normally take without hesitation.
But your finger hovers over the mouse.
"What if this one loses too?"

Or maybe you do enter...
Only to snatch a tiny profit because you can't bear the thought of giving anything back.
Or you skip the trade altogether.
Not because the setup was bad.
Because yesterday never really left you.
Here's something traders don't talk about enough:
Just because a new trading day has started doesn't mean your emotions got the memo.
Your platform reset.
Your charts reset.
Your P&L reset.
Your nervous system didn't.
A heavy loss can linger far longer than we realize.
Not just in your mind...
In your body.
You sit a little tighter.
You hesitate a little longer.
Every red candle feels more threatening than it did last week.
It's subtle.
So subtle that most traders don't even notice it's happening.
They simply conclude,
"The market feels different today."
Maybe.
Or maybe you do.
This is why some traders have two losing days in a row even though only one bad trading session actually happened.
The second day isn't caused by the market.
It's caused by the emotional residue of the first.
Professional athletes understand this.
If they pull a muscle, they don't pretend they're fully recovered the next morning.
They assess it.
Adjust.
Give themselves time.
Traders rarely do the same with their minds.
We expect ourselves to absorb a painful loss, sleep for eight hours, and wake up emotionally brand new.
That's not how people work.
So here's something worth trying after a difficult session.
Instead of asking,
"What should I trade tomorrow?"
Ask,
"What am I still carrying from today?"
The answer might surprise you.
Maybe it's frustration.
Maybe it's embarrassment.
Maybe it's the need to prove yesterday was a fluke.
Whatever it is, bring it into the light.
Because emotions lose a lot of their power once you acknowledge them.
The goal isn't to become a trader who never feels disappointment.
That's impossible.
The goal is to stop letting yesterday's emotions quietly write today's decisions.
Every trading day deserves a fresh mind.
Not just a fresh chart.