Oracle Cloud Sales Surge 121%
....................................................................................................................


Good morning.
Well, Wall Street has made it through four straight losing days. Now it gets to find out whether inflation will make Friday even more interesting.
US stock futures are slightly higher this morning, but the S&P 500 and Nasdaq are still heading for a losing week.
The big event is the latest Consumer Price Index report. Economists expect inflation to come in at 3.4% for August, unchanged from July. It’s the final major inflation reading before the Federal Reserve meets next week.
And then there’s oil.
Brent crude has climbed above $106 a barrel, while diesel has hit a record $6 per gallon. That’s not exactly the kind of backdrop investors want when they’re hoping inflation will cool.
Traders are already getting nervous. The odds of a Fed rate hike this month have jumped to 72%, up from roughly 50-50 last week.
So, good morning to everyone except inflation.
Wall Street has one number to watch today.

📊 August CPI Report Takes Center Stage for Fed Rate Decision
Markets are braced for the pivotal August consumer price index release, with consensus projecting headline inflation at 3.4% annualized and a 0.4% month-over-month jump. The data arrives at a critical juncture for a split Federal Reserve debating whether to resume rate hikes at its upcoming September policy meeting.
💻 Oracle Beats on 121% AI-Driven Cloud Infrastructure Surge
Oracle reported stronger-than-expected cloud results, powered by an enterprise AI infrastructure buildout that drove cloud infrastructure sales up 121% to $7.4 billion. The performance beat Wall Street's $7.19 billion target, underscoring heavy commercial appetite for its expanding data center network.
⛽ U.S. Diesel Crosses Record $6 as Refinery Disruptions Spread
U.S. retail diesel fuel prices topped a record $6 per gallon, sparking warnings of severe inflationary ripple effects across domestic freight, rail, and grocery supply chains. The price surge stems from persistent refinery outages and export bottlenecks triggered by prolonged conflicts in the Middle East and Eastern Europe.
🛢️ Oil On Pace for First $100 Weekly Close Since Mid-May
Crude benchmarks softened slightly on Friday but remained on course to finish the week comfortably above $100 a barrel, with Brent trading near $106 and WTI holding above $101. Ongoing shipping disruptions through key Middle East sea lanes have kept supply deficit premiums firmly embedded across global energy desks.
📉 Adobe Slips on Soft Outlook Stoking AI Competition Worries
Adobe shares fell 3% in extended trading after its fourth-quarter revenue forecast of $6.80 billion to $6.85 billion fell short of Wall Street's $6.85 billion consensus midpoint. The light forward guidance renewed market anxieties over market-share pressure from emerging generative AI application platforms.
₿ Bitcoin Slips Below $77K on Hot PPI and 19-Year Yield Highs
Bitcoin tumbled below the $77,000 mark as higher-than-expected U.S. PPI data—which rose 5.4% in August—coincided with crude topping $100. Resurgent inflation pressures triggered a fresh wave of risk-off selling, driving the U.S. 30-year Treasury yield to its highest mark since 2007.
🏛️ Global Bond Selloff Nears 5% U.S. 10-Year Yield Milestone
A synchronized rout across sovereign debt pushed the U.S. 10-year Treasury yield toward the key 5% threshold on Friday. Global borrowing costs reached multi-decade highs following the ECB's rate hike, persistent triple-digit oil prices, and rising wagers on near-term Fed tightening.

News Can Change Your Trading Costs
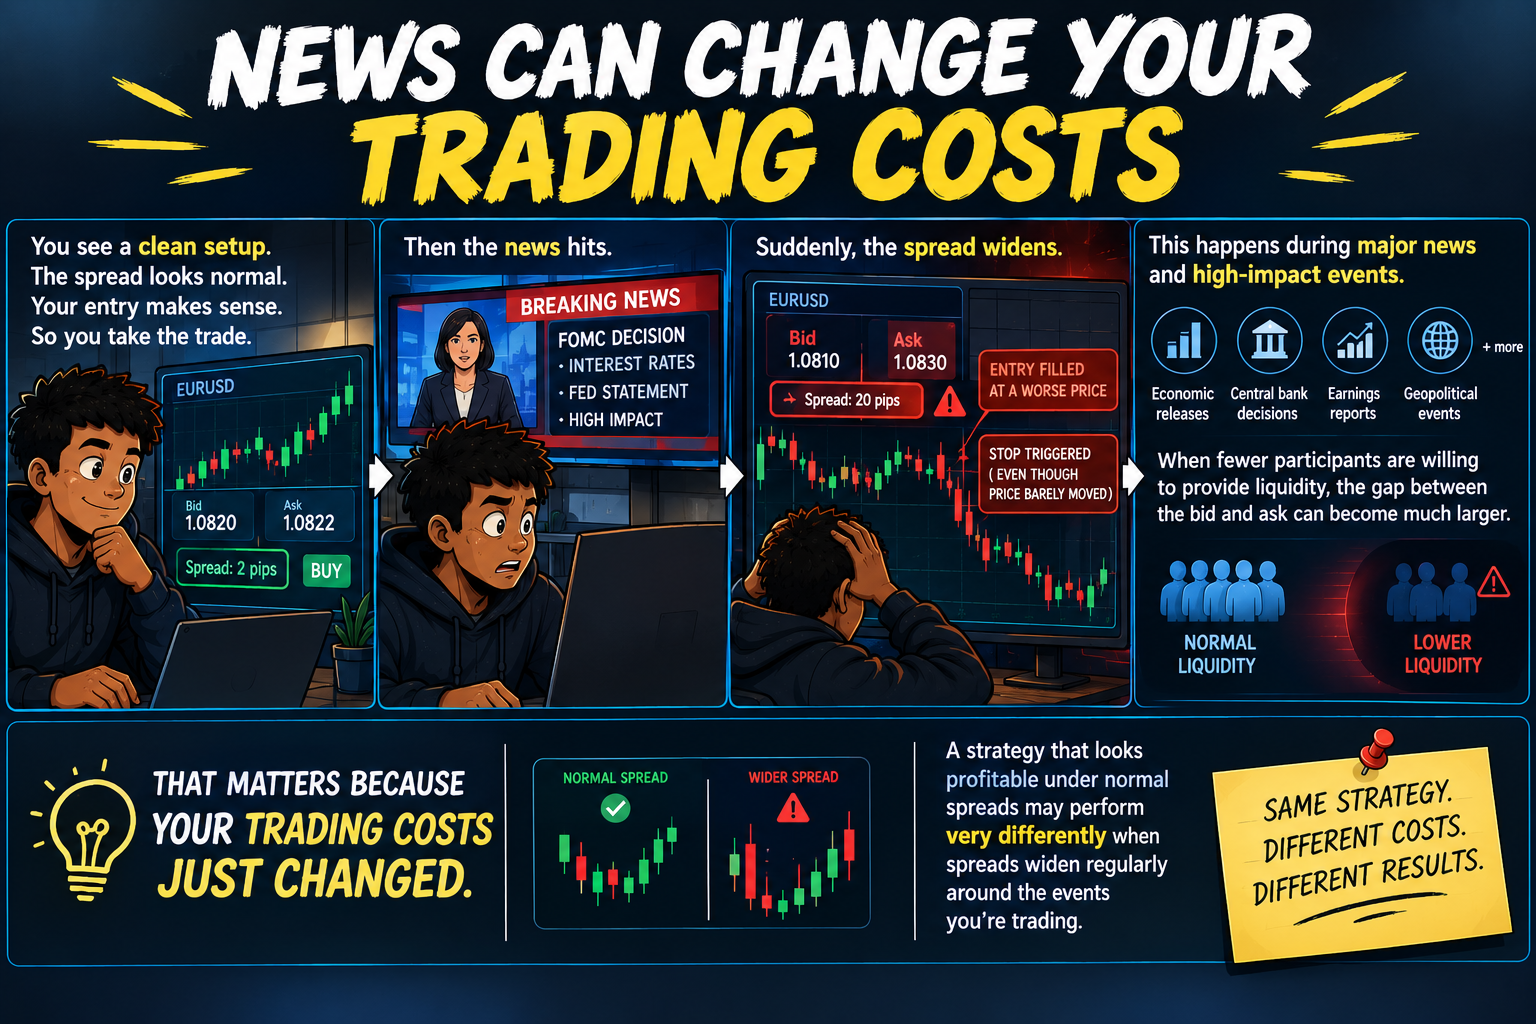
You see a clean setup.
The spread looks normal. Your entry makes sense. So you take the trade.
Then the news hits.
Suddenly, the spread widens. Your entry gets filled at a worse price than expected, or your stop gets triggered even though the market barely moved in the direction you expected.
This is one of the costs traders often overlook.
During major economic releases, central bank decisions, earnings, geopolitical events, and other high-impact news, liquidity can change quickly. When fewer participants are willing to provide liquidity, the gap between the bid and ask can become much larger.
That matters because your trading costs just changed.
A strategy that looks profitable under normal spreads may perform very differently when spreads widen regularly around the events you're trading.
And if you don't account for that in your testing, your backtest can give you a false sense of confidence.
Before trading through major news, know how your market and broker typically behave.
Check the usual spread conditions. Know when volatility tends to increase.
Consider whether your strategy actually needs to be exposed during the announcement.
Sometimes the best trade is simply waiting for conditions to normalize.
Your entry isn't the only thing that matters.
The cost of getting into the trade matters too.
Trading isn't just about finding setups. Small details around execution, liquidity, and market conditions can have a major impact on results.
Explore more market perspectives and newsletters here:

Ultimate Oscillator
Developed by Larry Williams in 1976, the Ultimate Oscillator (UO) solves the primary weakness of single-timeframe momentum indicators like standard RSI or Stochastics: false divergence signals.
Moving on a scale from 0 to 100, the UO incorporates three distinct cycle lengths—typically 7, 14, and 28 periods—weighting the shortest timeframe the heaviest.
By blending short, medium, and longer-term buying pressure into a single curve, it filters out temporary market noise and identifies durable turning points.
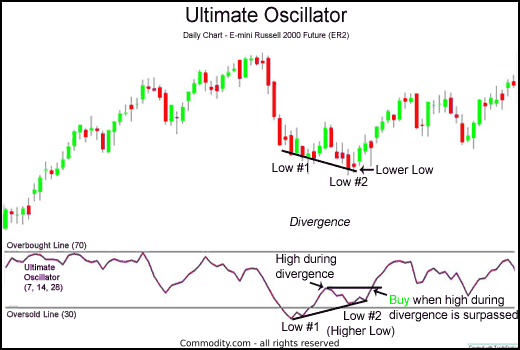
Ultimate Oscillator Multi-Timeframe Divergence Structure. Source: Commodity.com
🔴 The Red Zone (Above 70 / Overbought)
The Meaning: The indicator line surges above 70. Multi-timeframe buying pressure has expanded to statistical extremes, signaling that the rally is running on thin air across short, intermediate, and longer-term cycles simultaneously. The Move: Exercise caution. Do not chase new long positions. Williams’ rule states that an overbought reading alone is not an automatic sell—it serves as the trigger zone to watch for bearish divergence and a subsequent breakdown.
🟡 The Yellow Zone (30 to 70 / Equilibrium)
The Meaning: The oscillator moves comfortably within the central 30 to 70 range, fluctuating around the neutral 50 midline. The Move: Hold and wait. Buying pressure and selling pressure are balanced across all three timeframes. Trend continuation strategies apply here, but there are no multi-cycle extremes to trigger contrarian reversal setups.
🟢 The Green Zone (Below 30 / Oversold)
The Meaning: The line drops below 30. Multi-period selling pressure is severely stretched, reflecting multi-timeframe panic selling and capitulation. The Move: Get ready. The market is primed for a snapback. Watch for a bullish divergence to form while the oscillator is below 30 to prepare for a high-probability reversal entry.
🔍 Two Simple Signals to Watch
1. Williams’ 3-Step Bullish Divergence Rule
Larry Williams designed a strict 3-step sequence to eliminate false bottom calls:
- Step 1: The oscillator prints a trough below 30.
- Step 2: Price makes a lower low, but the oscillator forms a higher low (Bullish Divergence).
- Step 3 (Execution): The oscillator breaks above the highest peak it printed between the two lows. Only when this intermediate peak is surpassed do you pull the trigger on a long trade.
2. The 50 Midline Failure Swing
Use the central 50 mark to manage existing positions and catch trend failures early.
- The Logic: In an active uptrend, pullbacks should find support near or slightly above the 50 level. If the oscillator fails to stay above 50 and slips below 45, it indicates that multi-timeframe buying momentum has broken down, serving as an early exit signal ahead of price deterioration.
💡 The Simple Secret
Think of the Ultimate Oscillator as a committee vote instead of a single analyst. Standard oscillators rely on one timeframe (e.g., 14 days), making them prone to getting faked out by short-term spikes. The Ultimate Oscillator polls the 1-week, 2-week, and 4-week trends all at once (4×Short+2×Medium+1×Long). If all three agree that the market is overextended, the resulting reversal signal carries significantly higher institutional weight.

Everyone Agrees. So You Feel Safe.
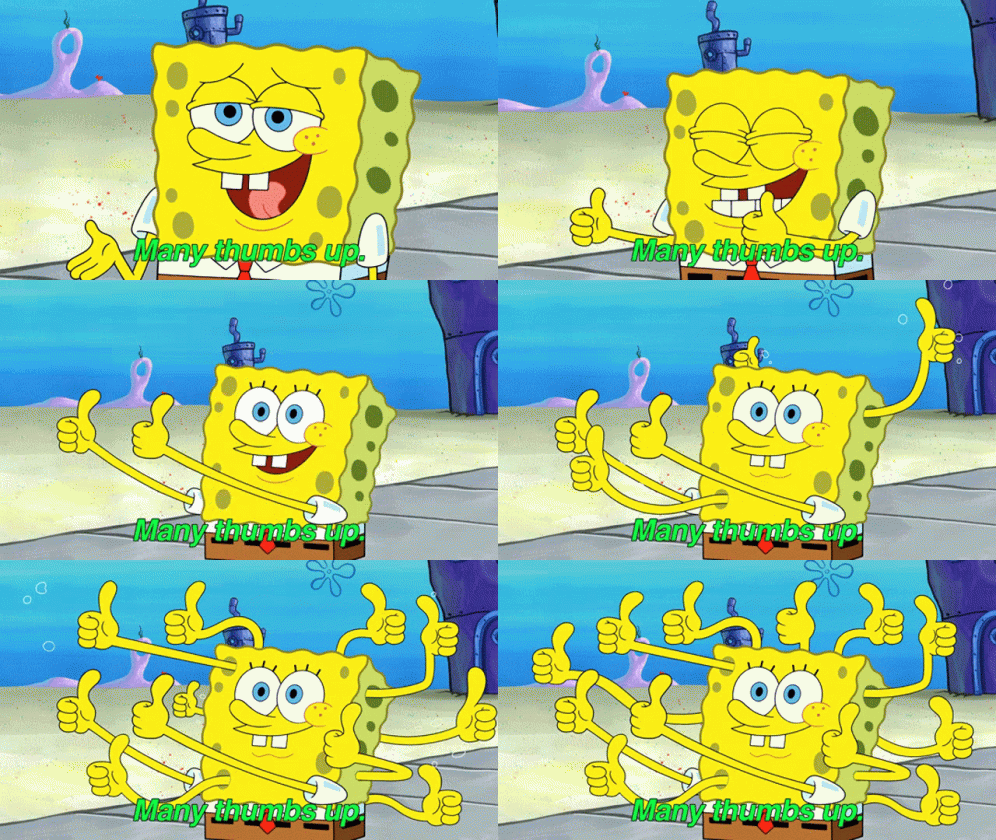
There’s a particular kind of confidence that only exists inside a group chat.
You post the chart.
One person replies, “Bullish.”
Another says, “Exactly what I’m seeing.”
Someone else drops a rocket emoji.
Then another trader sends a screenshot with the same level you marked.
Now you're sitting there thinking:
“Okay. This is definitely the trade.”
But what actually happened?
Did your analysis get better?
No.
You just found five people who already agreed with you.
And somehow, agreement started feeling like evidence.
That’s the trap.
The first person says they're bullish.
The next person sees the bullish idea and starts looking for reasons to support it.
Then everyone builds on everyone else's confidence.
Ten minutes later, the group has created this beautiful little bubble where nobody wants to be the person saying:
“Hold on... what if we're wrong?”
Because disagreeing with the group feels uncomfortable.
And when money is involved, comfort can become very expensive.
The most dangerous part is that this doesn't feel like groupthink.
It feels like research.
You're collecting opinions.
Comparing charts.
Gathering confirmation.
But if all ten opinions came from the same idea, you haven't really gathered ten independent views.
You've gathered one bias ten times.
That's a huge difference.
Imagine ten friends standing outside looking at a dark sky.
The first says, “I think it's going to rain.”
Everyone else agrees.
Does that make rain more likely?
Maybe.
But if none of them actually checked the forecast, you've just created a very confident group of people holding umbrellas they may not need.
Trading communities work the same way.
So before you let a crowded opinion strengthen your next trade, try something uncomfortable.
Form your own view BEFORE reading the room.
Write down:
What do I see?
What would make me wrong?
Where is my entry?
Where am I out?
Then open the group chat.
Not to borrow conviction.
To challenge your own.
Because a good trading community should make your thinking sharper, not make your thinking unnecessary.
And remember:
Consensus can validate a thesis. It cannot validate a trade.
The market gets the final vote.
Not your group chat.