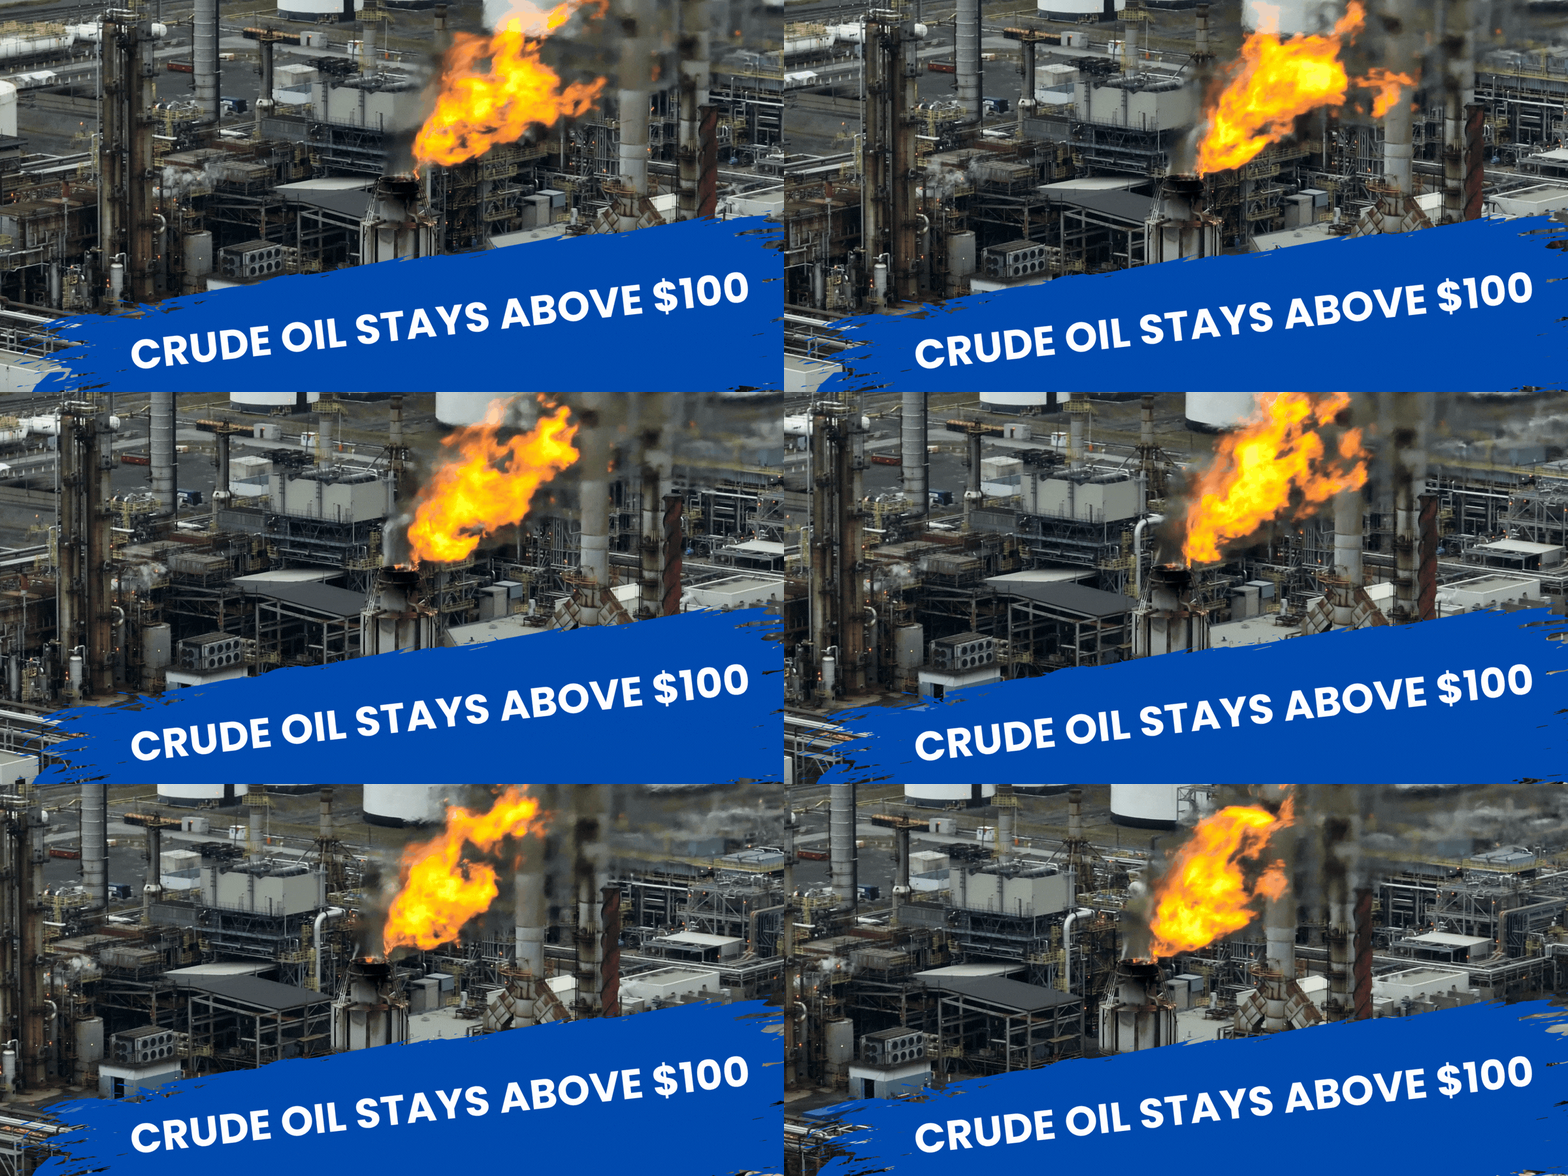
Crude Oil Stays Above $100
....................................................................................................................


Good morning.
Apparently, Wall Street needed one night to get over the Fed.
Stocks took a hit after Wednesday’s rate hike, then came right back swinging Thursday. The Dow gained 0.6%, the S&P 500 jumped 1.1%, and the Nasdaq surged 1.7%, led by technology stocks.
Now the market is taking a breather.
US stock futures are barely moving this morning, with Dow futures up just 0.08% while S&P 500 and Nasdaq futures are flat.
The interesting part isn't really the Fed anymore.
It’s AI.
Despite higher rates and inflation concerns, investors are still betting that the AI boom can keep driving corporate profits. That optimism helped tech stocks bounce hard on Thursday.
But there’s another thing to watch today: Fed officials.
Michelle Bowman and Jeffrey Schmid are scheduled to speak, giving investors another chance to hear how policymakers are thinking about Wednesday’s unanimous rate hike.
Meanwhile, the week is still mixed. The Dow is down 1.5%, the S&P 500 is down 0.3%, while the Nasdaq is up 0.3%.
So Friday starts quietly.
But after Thursday's comeback, Wall Street may be asking one question:
Was that just a bounce, or is AI ready to take the wheel again?

📊 U.S. Stock Futures Flat Following Post-Fed Bounce
U.S. stock index futures traded in a narrow band early Friday following Wall Street's relief bounce after the Federal Reserve's first interest rate hike in three years. Dow futures gained 41 points while S&P 500 and Nasdaq-100 contracts held flat, supported by an Asian tech rally that saw South Korea's Kospi climb 2.67% and Japan's Nikkei 225 rise 1.90%.
🛢️ Oil Slips 2% on Easing Saudi Supply Concerns
Crude benchmarks declined for a third consecutive session Friday, with Brent falling 2.2% to $102.53 a barrel and WTI sliding to $100.04. Market participants pared risk premiums after initial assessments indicated damage to Saudi export infrastructure was limited, easing immediate supply shortage anxieties.
🏦 Bank of Japan Lifts Rates to 31-Year High
The Bank of Japan raised its policy interest rate to a 31-year high in a 7-2 vote, accelerating its monetary tightening cycle to curb upside inflation risks above its 2% target. The move prompted broad repositioning across foreign exchange and sovereign debt markets as global central banks tighten policy in tandem.
💻 Oracle Affirms Project Jupiter Progress as Stock Stabilizes
Oracle shares steadied after management confirmed its flagship Project Jupiter data center facility in New Mexico is proceeding under active permits, despite regulatory delays facing a connected microgrid. The stock remains down 26.9% year-to-date as investors balance heavy AI capital expenditures against long-term data center expansion.
🥇 Gold Defies Fed Hike as Easing Yields Target $4,400
Spot gold reclaimed its 100-day simple moving average, shrugging off the Federal Reserve's latest rate increase to test the $4,400 per ounce technical resistance level. A pullback in crude prices and easing Treasury yields revived bullion demand despite elevated odds of another rate increase later this year.
🪙 Bitcoin Faces $80,000 Ceiling on Regulatory Setback and Rates
Bitcoin encountered stiff technical resistance near $80,000 as tighter Federal Reserve monetary policy and legislative delays surrounding the CLARITY Act weighed on market sentiment. Digital asset analysts noted that legislative friction and higher global borrowing costs could delay broader crypto expansion into the fourth quarter.
⚠️ Middle East Energy Shock Stirs Global Stagflation Warnings
Persistent triple-digit crude prices and multi-decade highs in global sovereign bond yields have heightened warnings of emerging stagflation across major economies. While massive AI capital expenditures have supported headline GDP growth and kept equities near records, economists warn that protracted energy costs threaten to erode consumer demand.

Holding a Trade Has a Cost
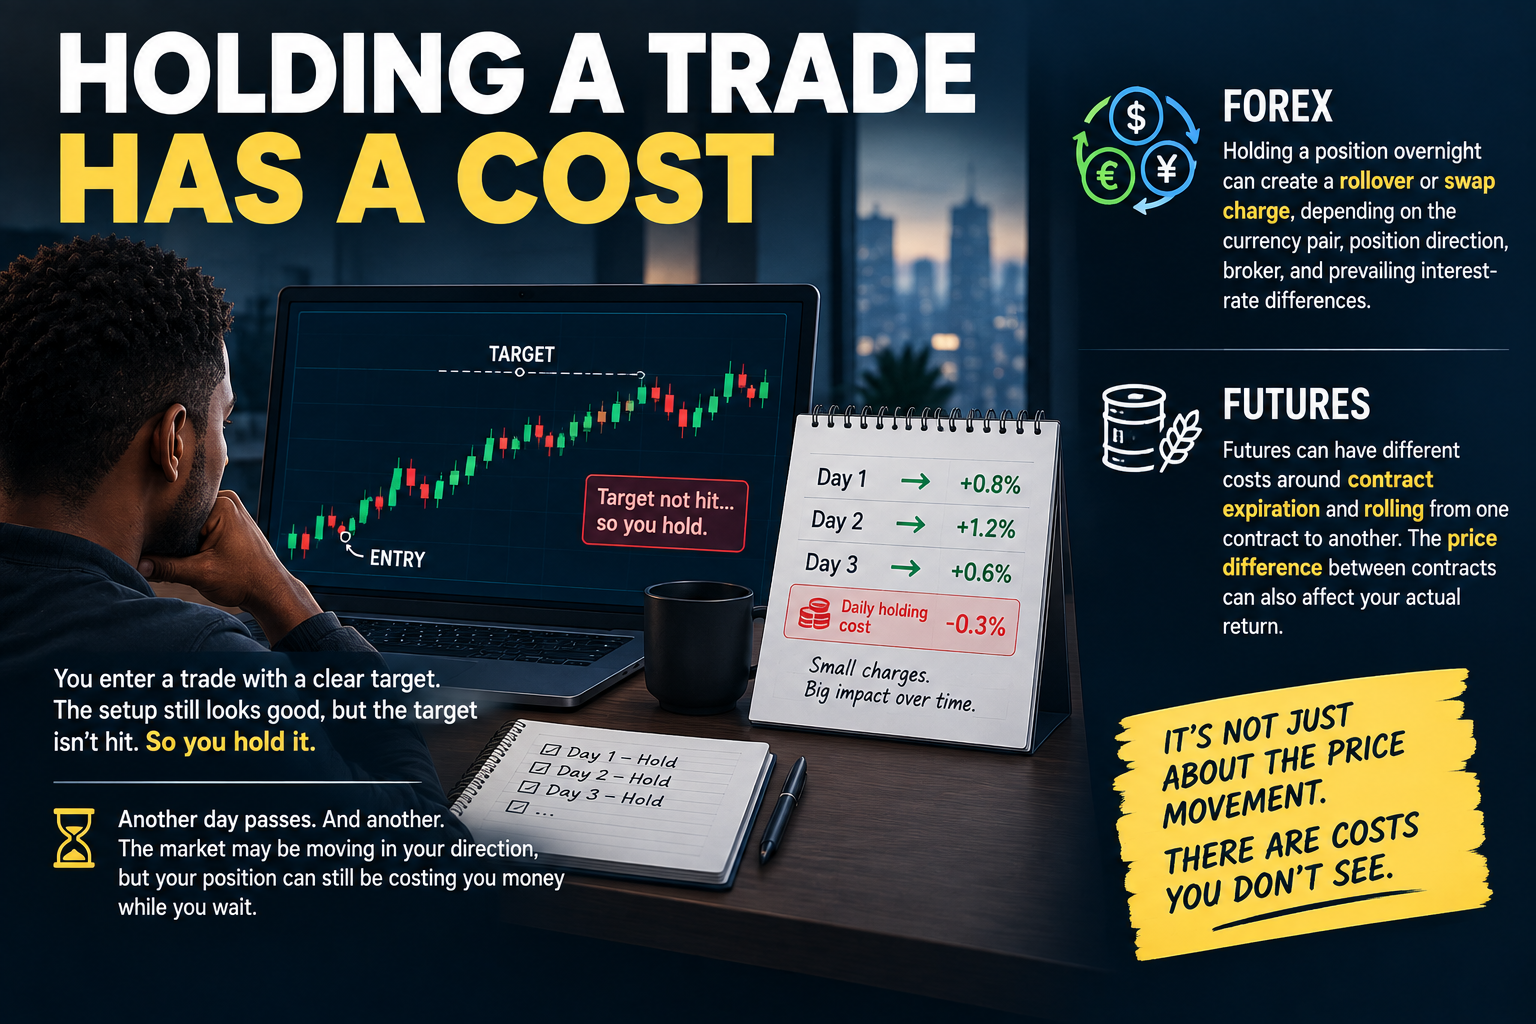
You enter a forex or futures position with a clear target.
The trade doesn't reach your target that day, but the setup still looks good. So you decide to hold it.
Then another day passes.
And another.
The market may be moving in your direction, but your position can still be costing you money while you wait.
In forex, holding a position overnight can create a rollover or swap charge, depending on the currency pair, position direction, broker, and prevailing interest-rate differences.
Futures can have different costs around contract expiration and rolling from one contract to another. The price difference between contracts can also affect your actual return.
These costs are easy to ignore when you're focused on the chart.
But if you're holding positions for days or weeks, they can add up.
A trade that looks profitable based only on its entry and exit price may produce a much smaller return after financing, rollover, commissions, and other trading costs.
That's why your holding period should be part of your trade plan.
Before keeping a position open, know what it costs to hold it and when those costs apply.
A small daily cost may not matter on a short-term trade.
But over a longer period, it can become part of the trade's outcome.
Don't just calculate where the market needs to go. Calculate what it costs to stay in the trade.
Trading costs don't always show up on the chart. Understanding the less obvious expenses behind a position can help you evaluate trades more realistically.
Explore more market newsletters here:

The Bullish Harami
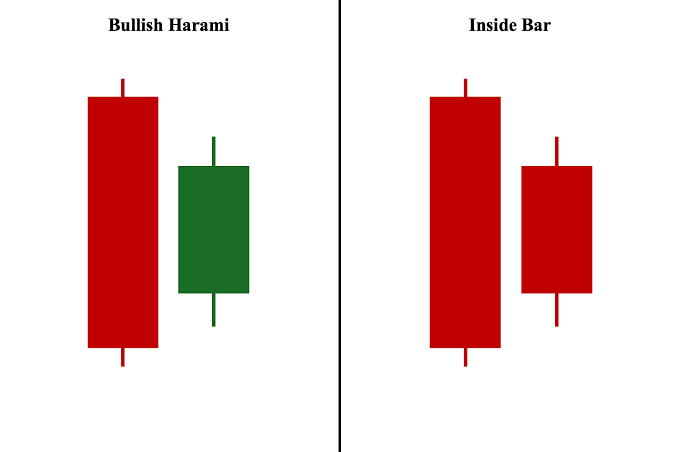
Bullish Harami Structure and Inside-Bar Mechanics. Source: Alchemy Markets
The Bullish Harami is a two-candle reversal and inside-bar pattern that forms at the bottom of an extended downtrend. The word harami comes from the archaic Japanese word for "pregnant." It features a large bearish (red) "mother" candle followed immediately by a much smaller bullish (green) "baby" candle whose real body is completely contained inside the vertical range of the prior candle's real body. It signals that aggressive downward momentum has hit a sudden wall of resistance, trapping short sellers and hinting at an impending trend reversal.
🔴 The Red Zone (Candle 1: The Heavy Downward Drive)
The Meaning: A large red candle prints in the direction of the dominant downtrend. Bears appear to be firmly in control, driving prices lower with strong selling momentum.
The Move: Exercise patience. Do not try to catch the falling knife yet. The trend is still pointing down until the second candle proves seller exhaustion.
🟡 The Yellow Zone (Candle 2: The Inside Squeeze)
The Meaning: The market gaps up (or opens higher) and prints a small green body completely nested inside the previous red candle's body.
The Move: Watch closely. The rapid selling has halted abruptly. The bears were unable to push the price lower than the prior close, signaling hesitation and loss of conviction. Prepare your setup, but wait for the confirmation candle before entering.
🟢 The Green Zone (Candle 3: The Bullish Breakout Confirmation)
The Meaning: A subsequent candle pushes upward and closes decisively above the high or open of the initial large red candle.
The Move: Go! A confirmed break above the pattern's mother-candle resistance confirms that buyers have taken over. Place your stop-loss just below the lowest wick of the pattern (the bottom of Candle 1 or Candle 2).
🔍 Two Simple Signals to Watch
1. The Harami Cross (Doji Baby Candle)
Pay close attention to the shape of the second inside candle.
- The Logic: If the second candle is not just small, but forms a Doji (where the open and close are virtually identical, creating a cross), the pattern becomes a Bullish Harami Cross. This indicates extreme indecision and carries far higher reversal conviction than a standard small candle.
2. The Volume Drop on the Inside Bar
Track the volume shift between the first and second candle.
- The Logic: Volume should be high on Candle 1 (panic selling) and noticeably dry up on Candle 2. A sharp drop in volume on the second candle proves that sellers have completely run out of inventory to dump, leaving the market ripe for buyers to drive an aggressive bounce.
💡 The Simple Secret
Think of the Bullish Harami as a moving car slamming on the brakes. The first candle represents full forward speed downhill; the second inside candle shows the car stopping dead in its tracks. While an Engulfing pattern is an aggressive counterattack that overwhelms the opponent right away, a Harami is a warning shot—it tells you the selling pressure has evaporated and the engine is about to shift into reverse.

The Trade Looked Fine Until You Tried to Get Out
The entry looked perfect.
Clean level.
Nice setup.
Price was sitting exactly where you wanted it.
So you sized in.
Then the market moved against you.
Not by much.
Just enough to make you want out.
You hit close.
And that's when you discovered the part of the trade you never planned for:
There wasn't enough liquidity waiting for you.
Your order starts eating through the available bids.
Your average exit gets worse.
You close more...
The fill gets worse again.
Now the trade that looked perfectly manageable on the chart suddenly feels much bigger than expected.
That's the liquidity event blind spot.
Most traders spend enormous amounts of time asking:
"Where should I enter?"
Far fewer ask:
"What happens when I need to exit this size?"
That's a mistake.
Because your position isn't just a number.
It's an order that has to interact with other orders in the market.
And when the available liquidity is thin, getting out can be a very different experience from getting in.
This becomes especially ugly during fast markets.
News hits.
Volatility jumps.
The order book thins out.
You want to exit immediately.
So does everyone else.
Suddenly, the price you thought you could exit at is more of a suggestion than a guarantee.
And here's the psychological trap:
The chart still looks fine.
Your technical setup didn't suddenly become invalid.
But your execution conditions changed.
Now you're trapped between two bad choices:
Stay in and take more risk...
Or exit and accept a worse fill.
Neither feels good.
That decision should have been considered before the trade existed.
I'm not saying every trader needs to stare at Level 2 all day.
But size matters.
Liquidity matters.
And knowing how your market behaves when things get fast matters.
Before taking a larger position, ask yourself:
"If I had to get out RIGHT NOW, would this market realistically absorb my size without causing serious slippage?"
If you don't know the answer, that's worth knowing before you click.
Because risk isn't just where your stop sits.
Risk is what happens between your decision to exit and your actual fill.
And sometimes the most dangerous position isn't the one with the wrong entry.
It's the one that's easy to enter...
...but surprisingly difficult to escape.