AI Stocks Slide on Slowdown
....................................................................................................................


Good morning.
Wall Street just got a message it probably didn’t want to hear: Slow down.
Two of the biggest names in AI are calling for a more cautious pace of development, and tech traders aren't taking it lightly. Anthropic CEO Dario Amodei argued over the weekend that AI companies should slow down to address safety concerns. OpenAI CEO Sam Altman agreed.
The reaction? Nasdaq-100 futures dropped 1.8%, with chip stocks like Nvidia leading the slide. Asian memory-chip names also took a hit.
That’s a big deal because Wall Street has been betting heavily on AI continuing to move at full speed. A slowdown could raise questions about how quickly the massive AI investment cycle can keep growing.
And AI isn't the only problem this morning.
Brent crude is back near $108 a barrel after Saudi Arabia shut down a key pipeline as the Middle East conflict spreads.
Then comes Wednesday's Federal Reserve meeting.
After Friday's inflation report, traders now see an 86% chance of a rate hike.
So Monday has brought three things traders love to hate:
AI uncertainty. Expensive oil. And a Fed decision.
Good morning, indeed.

🛢️ Oil Jumps and Tech Sinks as Middle East Fears Mount
Crude prices surged Monday after Saudi Arabia shut down a critical export pipeline, stoking fresh inflation fears ahead of this week's expected Federal Reserve interest rate hike. The prospect of higher borrowing costs compounded a tech sell-off sparked by AI industry leaders backing calls to slow sector development over existential safety risks.
⚠️ AI Titans Amodei and Altman Rattle Markets with Safety Warnings
Blunt safety warnings from Anthropic CEO Dario Amodei and OpenAI CEO Sam Altman triggered sudden jitters across the AI trade within a 48-hour span. The cautionary rhetoric from the technology's primary pioneers has left investors reassessing aggressive tech valuations and potential regulatory hurdles.
💼 Larry Ellison Cancels Planned $7.5B Sale of Oracle Shares
Oracle co-founder and executive chairman Larry Ellison called off a previously announced plan to sell 50 million shares worth approximately $7.5 billion. The enterprise software giant confirmed the reversal on Saturday without providing an official reason for the cancellation.
👗 Shein Slides 10% Following Urgent Contact Lens Solution Recall
Shein shares fell as much as 10% in Hong Kong after health regulators in Australia and New Zealand issued an urgent recall for one of its contact lens products. The action followed laboratory testing that detected Burkholderia cepacia bacterial contamination within the packaging solution.
🤖 Z.ai Tumbles 10% on New $5B Share and Bond Sale
Shares of Z.ai dropped over 10% following the announcement of a $5 billion capital raise split between a share placement and convertible notes. The offering marks the company's second massive fundraising round in two months, following a $4 billion equity placement completed in July.
🛢️ Brent Pierces $108 After Drone Strike Shuts Saudi Pipeline
Brent crude spiked above $108 per barrel after Saudi Arabia halted flows along its critical 7-million-barrel-per-day East-West pipeline due to drone strike damage launched from Iraq. The closure severed the primary supply bypass around the disrupted Strait of Hormuz, sharply heightening global energy deficit risks.
₿ Bitcoin Defies Tech Rout to Reclaim $77,000 Level
Bitcoin diverged from broader technology equities to push back above $77,000 on Monday. The digital asset found resilient demand as an alternative hedge while equity bourses stumbled under the weight of AI safety concerns and escalating energy-driven inflation.

The Price You See Isn't Always the Price You Get
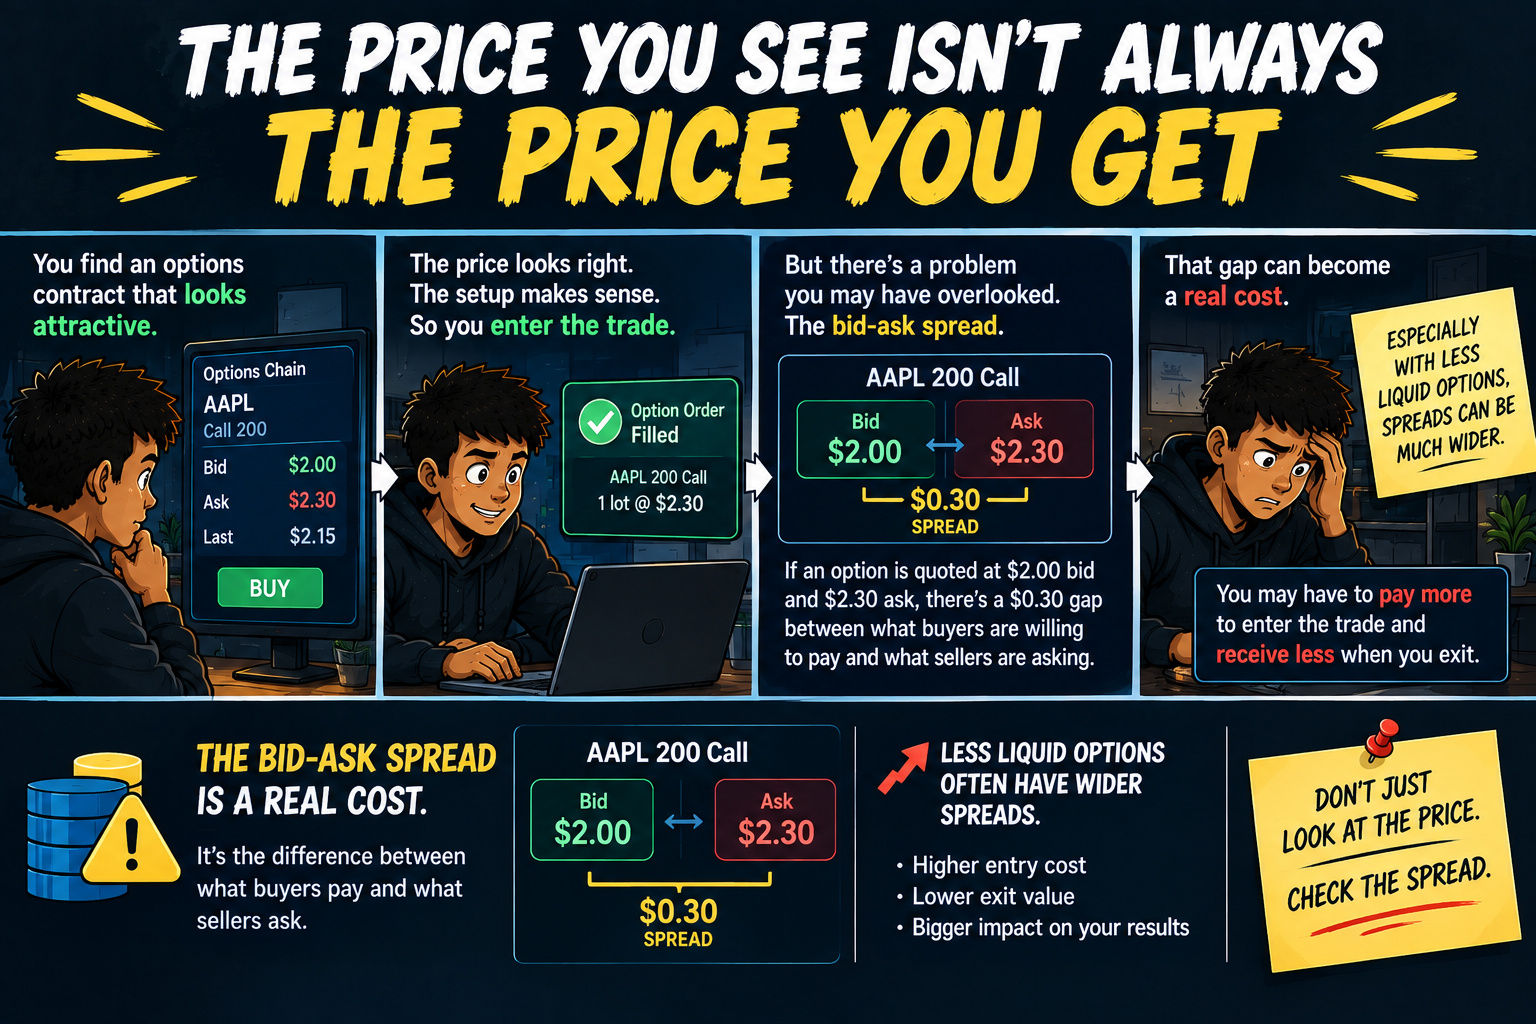
You find an options contract that looks attractive.
The price looks right. The setup makes sense. So you enter the trade.
But there's a problem you may have overlooked.
The bid-ask spread.
If an option is quoted at $2.00 bid and $2.30 ask, you're not really dealing with a $2.00 or $2.30 cost. There's a $0.30 gap between what buyers are willing to pay and what sellers are asking.
That gap can become a real cost.
It's especially important with less liquid options, where spreads can be much wider. You may have to pay more to enter the trade and receive less when you exit.
And if you're trading short-term moves, that difference can take a meaningful chunk out of your expected return.
A trade can be directionally correct and still lose money because your entry and exit costs were too high.
That's why the bid-ask spread should be part of your trade analysis.
Before entering, check how liquid the contract is, how wide the spread is, and whether your expected move is large enough to justify the cost.
Don't just ask, "Where is this option going?"
Ask, "What will it cost me to trade it?"
Because being right about the direction doesn't guarantee you'll make money.
Execution costs matter too.
Good trading decisions include more than market direction. Understanding liquidity, execution, and trading costs can help you spot risks that aren't obvious from the chart.
Explore more market newsletters here:

Three Black Crows
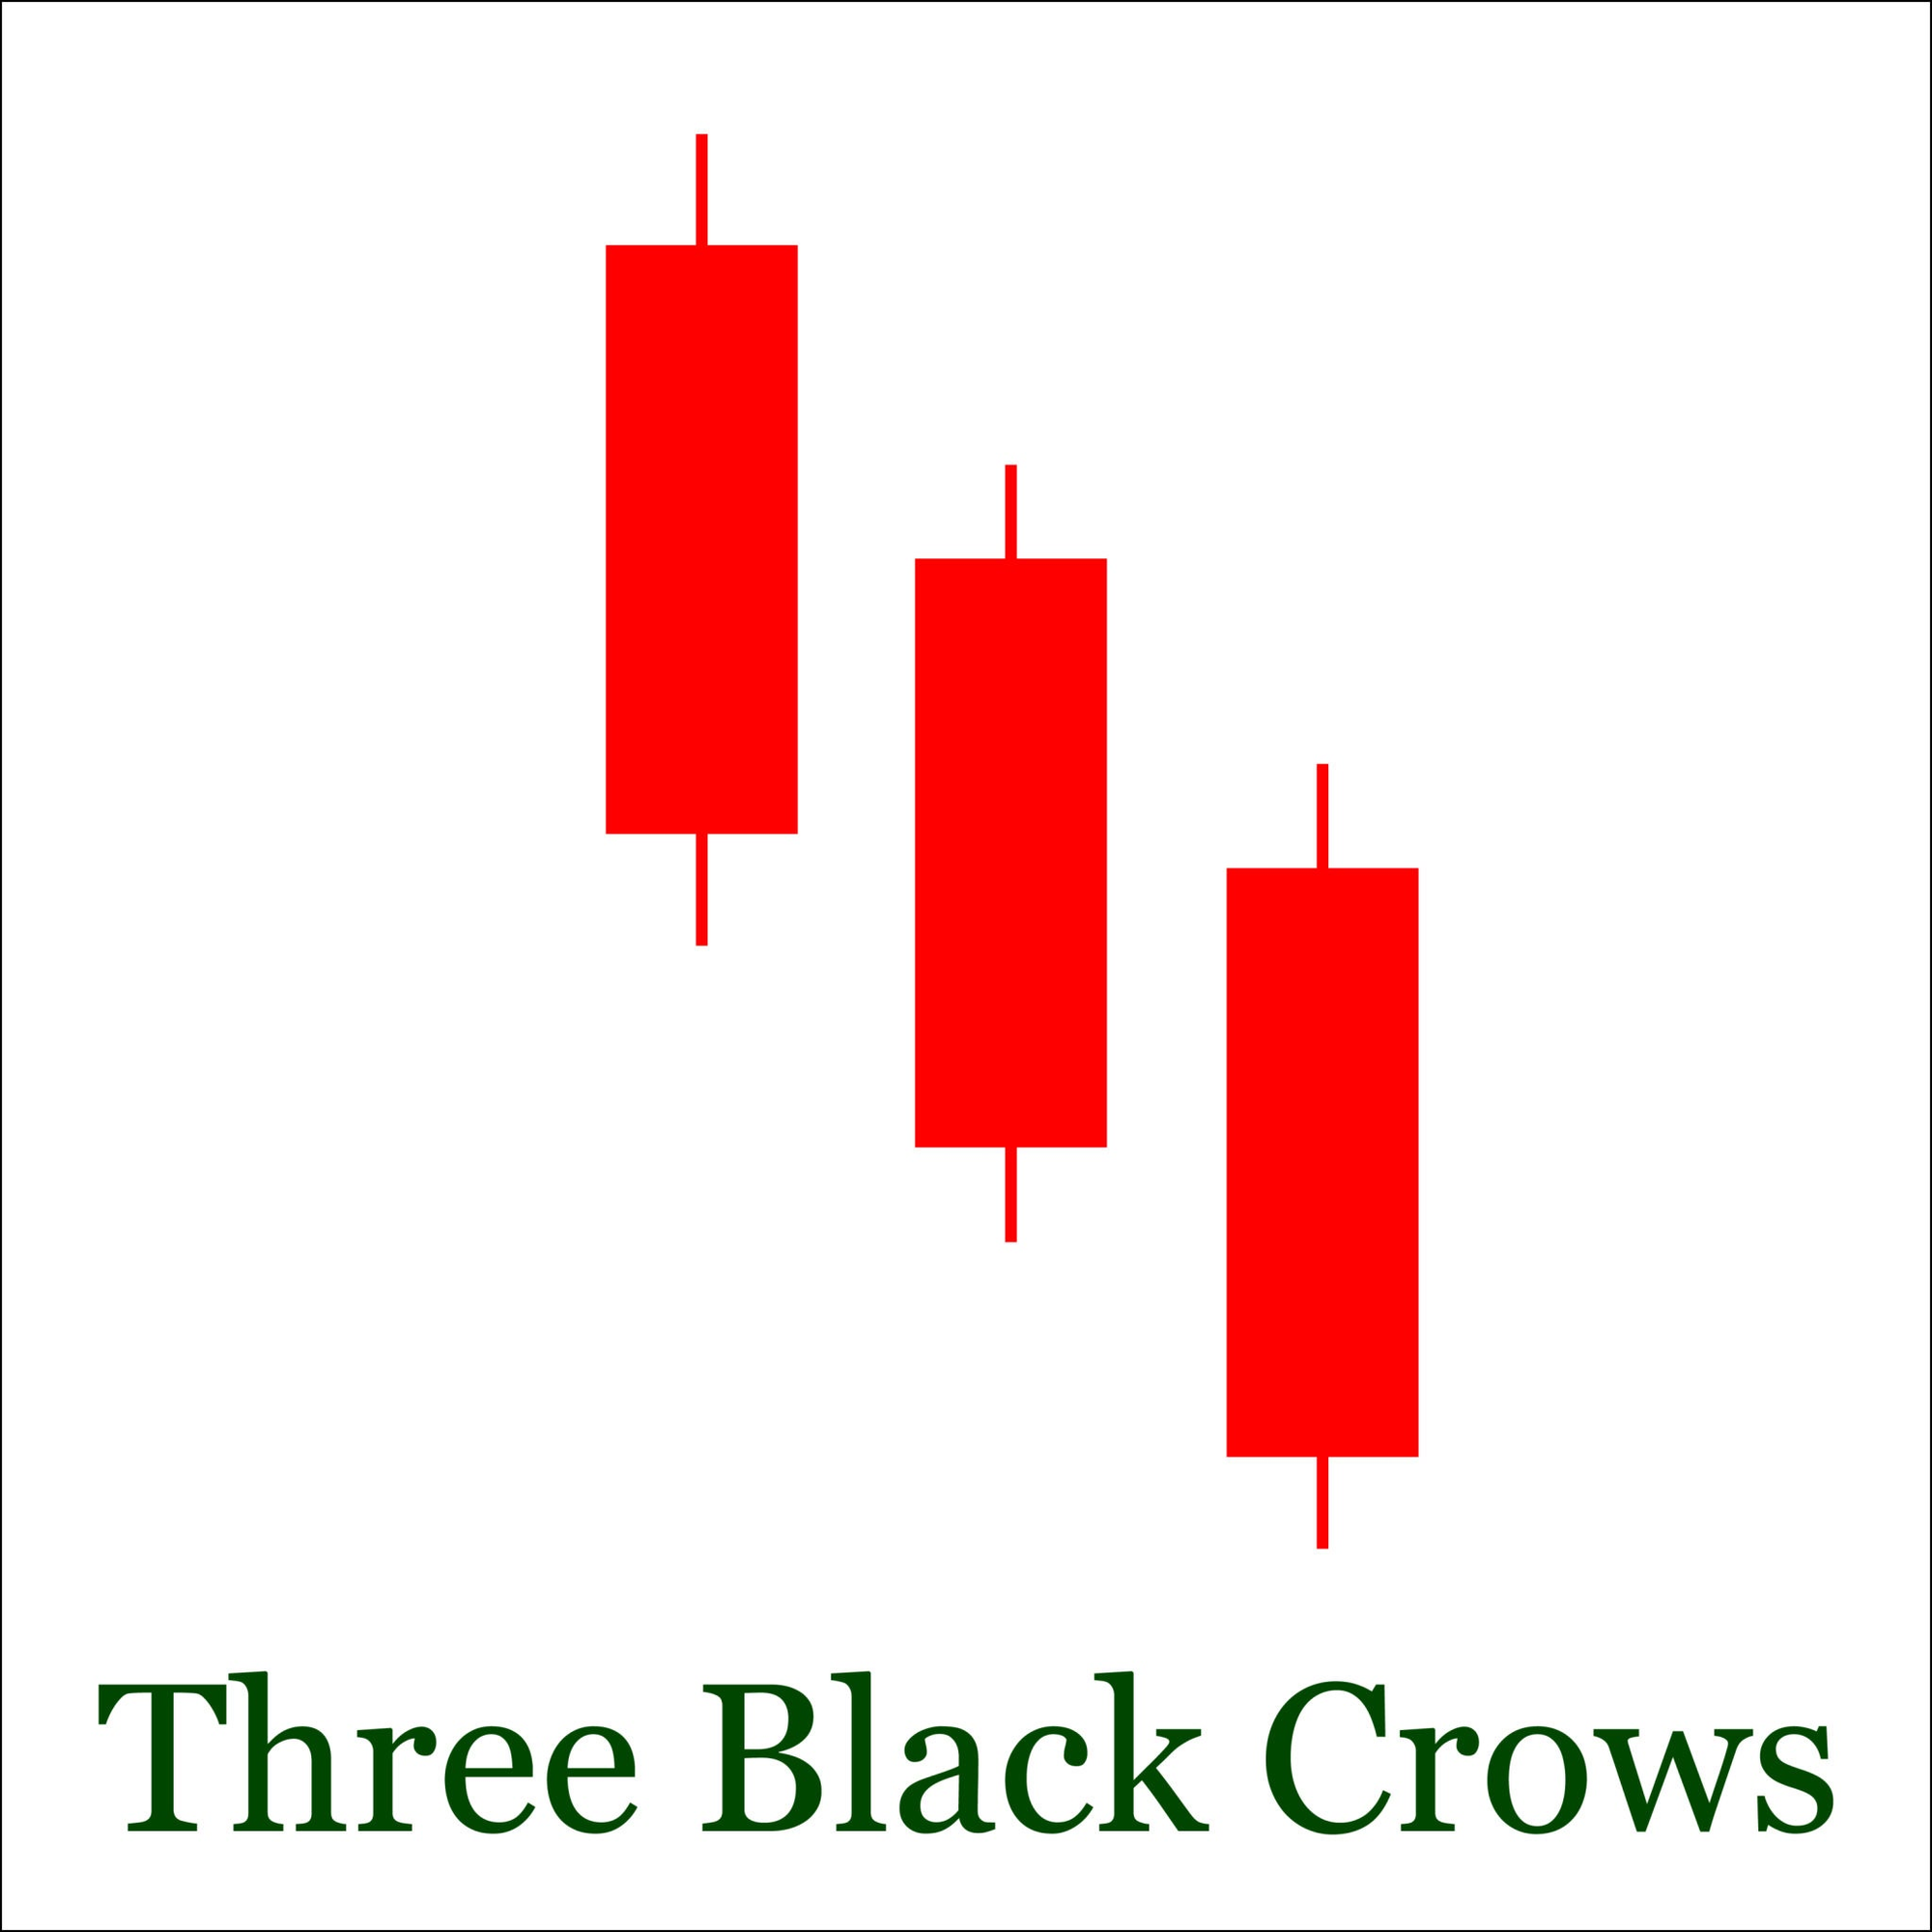
Three Black Crows Bearish Reversal Structure. Source: Pavlo Stavnichuk / Getty Images
The Three Black Crows is a high-conviction, three-candle bearish reversal pattern that forms at the peak of an extended uptrend or prolonged consolidation. The direct mirror image of the Three White Soldiers, it consists of three consecutive long, red (traditionally black) candles that make progressively lower opens and lower closes with small or nonexistent lower wicks. It signals that institutional distribution is fully underway and sellers have completely taken over the tape.
🔴 The Red Zone (The Prior Uptrend & First Crow)
The Meaning: The market is trading near the high of an uptrend when the first decisive red candle prints. While it breaks the string of bullish green bars, a single down day can easily be temporary profit-taking rather than a confirmed trend collapse.
The Move: Protect profits. Do not rush to short off the first candle alone, but tighten your trailing stop-loss on existing long positions as early distribution begins.
🟡 The Yellow Zone (The Second Crow Plunges)
The Meaning: The second candle opens within the body of the first candle and drives lower throughout the session, printing another long red body that closes below the low of the first candle.
The Move: Watch closely. A second consecutive heavy drop confirms that buyers are failing to defend pullbacks and sellers are liquidating with conviction. Prepare your short setup and calculate your risk parameters.
🟢 The Green Zone (The Third Crow Confirms)
The Meaning: The third candle opens within the body of the second candle and slides downward to close near its low, completing the three-step downward staircase.
The Move: Go! The close of the third candle is your official green light to exit remaining longs or enter a short trade. Place your protective stop-loss just above the opening price of the first crow.
🔍 Two Simple Signals to Watch
1. Lower Wick Size & Candle Extension (Exhaustion Warning)
Examine the shadows at the bottom of the candles and their relative body sizes.
- The Logic: Textbook crows close right at or very near their daily lows with minimal lower wicks, confirming persistent selling pressure into the close. If the third candle prints an unusually massive body or leaves a long lower shadow, it warns that the move may be temporarily oversold, making an immediate bounce likely before further downside.
2. The Relief Bounce (Retest of the Second or Third Crow)
Because three consecutive large red candles can rapidly push short-term oscillators into oversold territory, the market frequently pauses right after pattern completion.
- The Logic: Rather than chasing a short at the very bottom of the third crow, patient traders look for a shallow counter-trend retest back toward the midpoint of the second or third candle body. A failed bounce into that resistance zone offers an optimal, low-risk short entry.
💡 The Simple Secret
Think of Three Black Crows as an avalanche that gains irreversible momentum. On day one, the snow begins to slide; on day two, the mountain wall gives way; and by day three, the valley floor is completely buried. When this three-day cascade forms at a key resistance ceiling, upper channel boundary, or following an overbought momentum reading, it confirms that the bull trend is officially broken and a multi-leg bear trend has begun.

You Want the Trade Everyone Remembers
There’s a difference between wanting to make money...
…and wanting to prove something.
The second one is much more dangerous.
You start looking for the trade.
Not a good trade.
Not a clean trade.
The trade.
The one that makes the month.
The one that turns a normal account into a ridiculous screenshot.
The one you’ll remember six months from now and say:
"That was the trade that changed everything."
And once that idea gets into your head, ordinary trading starts to feel boring.
+1R?
Not enough.
A clean, repeatable setup?
Too small.
You start waiting for the monster move.
Then you start bending your rules to find it.
A little more size.
A little wider stop.
A little more patience when the setup is already invalid.
Because you're no longer thinking like someone building an edge.
You're hunting for a story.
That's the Trophy Trade Obsession.
And here's what makes it especially nasty:
A huge win can reinforce it.
You take one oversized position.
It works.
Now your brain has evidence.
"See? This is how I should be trading."
So the next trade needs to be bigger.
And the next one needs to be even better.
Before long, you're not measuring success by consistency.
You're measuring it by how impressive the last trade was.
That's not a sustainable way to trade.
Because trading careers aren't built around legendary positions.
They're built around ordinary decisions repeated well.
A trader who makes a modest return every month through controlled risk has something much more valuable than a trader who catches one spectacular move:
They have a process they can repeat.
That matters.
Because your account doesn't need one trade to validate you.
Your identity doesn't need one trade either.
You don't need a screenshot that makes everyone in the group chat jealous.
You need evidence that you can follow your process when nothing exciting is happening.
That's the real test.
So the next time you feel yourself hunting for the big one, ask:
"Would I still take this trade if nobody ever saw the result?"
That question strips away a lot of ego.
Because once nobody is watching, the trade suddenly has to justify itself.
And that's exactly how it should be.
The best traders aren't trying to become legends every Tuesday morning.
They're trying to make good decisions.
Again.
And again.
And again.
Until consistency becomes so normal that they don't need one spectacular trade to believe they're good at this.
That's the trophy worth chasing.