Fed Rate Hike Expected
....................................................................................................................


Good morning.
Three years is a long time to wait for a rate hike.
But today, the wait could finally be over.
The Federal Reserve is expected to raise interest rates by 25 basis points, marking the first increase since 2023. Traders are putting the odds at roughly 92%, although a surprise hold isn't completely off the table.
Why hike now?
Inflation.
Prices have stayed above the Fed’s 2% target for more than five years, with the ongoing Middle East conflict adding another layer of pressure through higher energy costs.
But the rate decision isn't the only thing markets will be watching.
The real clues could come afterward.
Investors will dig through the Fed's Summary of Economic Projections, especially the famous “dot plot,” looking for hints about where rates could go next.
And Fed Chair Kevin Warsh has made one thing clear: don't expect much advance warning. He'd rather officials debate the data behind closed doors and make the decision at the meeting.
So today isn't just about whether the Fed hikes.
It's about what comes next.
One rate decision.
One dot plot.
And a whole lot of traders trying to read between the dots.

🏦 Fed Set to Raise Interest Rates for First Time in Three Years
Markets are overwhelmingly pricing in a 25-basis-point interest rate increase on Wednesday as the Federal Reserve concludes its two-day September policy meeting. The move marks the central bank's first rate hike since 2023, driven by persistent inflation staying above the 2% target for five years and accelerated by energy supply shocks from the Middle East conflict.
💵 Dollar Edges Lower Ahead of Expected Fed Tightening
The U.S. dollar retreated from multi-week highs on Wednesday as crude oil prices paused and foreign exchange traders positioned for the Fed's policy decision. The greenback had gained ground alongside surging bond yields earlier in the week, pushing the Japanese yen to a one-week trough of 155.49.
🛢️ Oil Dips on Surprise Inventory Build Despite Saudi Pipeline Outage
Crude benchmarks declined on Wednesday as an unexpected uptick in U.S. commercial crude, gasoline, and distillate stockpiles offset supply deficit fears. Trading desks balanced the inventory data against structural supply risks following the drone strike on Saudi Arabia's East-West pipeline, with reports indicating Pentagon war costs have reached $38.1 billion through August.
🪙 Bitcoin Slides Toward $75,700 on Regulatory Stall and Fed Hike Cryptocurrencies faced renewed selling pressure after a key U.S. regulatory bill failed to advance in Washington, adding to macro headwinds from anticipated Federal Reserve tightening. Bitcoin dropped 4% during regular U.S. trading before stabilizing around $75,700 during the Asian trading session.
📈 10-Year Treasury Yield Hovers Above 5% Threshold Before Fed
The benchmark U.S. 10-year Treasury yield held near 5.004% early Wednesday as fixed-income investors stood by for Chairman Kevin Warsh's post-meeting press conference. Long-duration borrowing costs remained elevated across the curve, with the 20-year and 30-year yields holding flat at 5.409% and 5.372%, respectively.
📊 Investors Maintain Stock Allocations Despite Spiking Yields and Oil Global equity allocations remain resilient despite the 10-year Treasury yield piercing 5% and crude hovering near triple digits, with the S&P 500 up 10.8% and the Nasdaq Composite up 11.8% year-to-date. Bank of America's latest Global Fund Manager Survey confirmed institutional desks continue deploying cash into equities even as AI safety debates create short-term tech volatility.
🌏 Asian Shares Hold Narrow Range Ahead of Warsh Presser
Asia-Pacific equities traded in a cautious holding pattern on Wednesday, with MSCI's regional benchmark outside Japan edging up 0.3% while the Nikkei 225 dipped 0.1%. Regional desks paused as Brent crude hovered near $107 a barrel and the U.S. 10-year yield eased slightly to 4.987% ahead of the FOMC policy statement.

One Timeframe Doesn't Tell the Whole Story
You spot a clean setup on your chart.
The trend looks clear. The entry makes sense. Everything lines up.
So you take the trade.
Then you zoom out.
And the picture looks completely different.
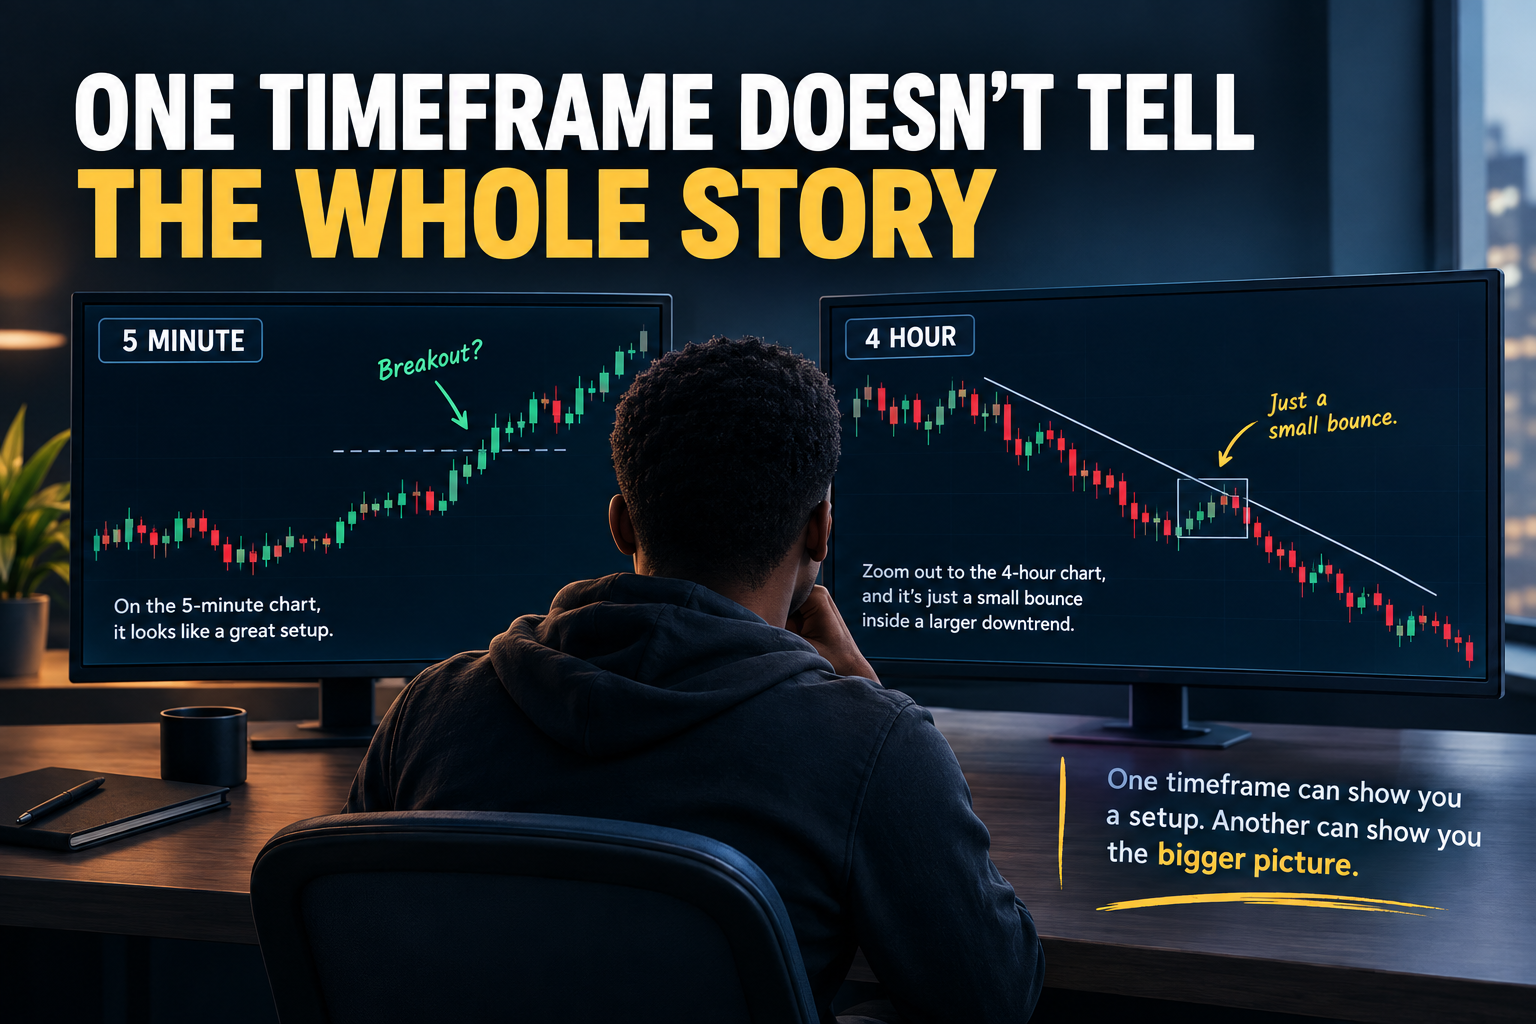
The move you're trading may be a small bounce inside a larger downtrend. What looks like a breakout on the 5-minute chart could be nothing more than resistance on the 4-hour chart.
This is what happens when you rely too heavily on one timeframe.
A single chart can show you what the market is doing right now, but it may not show you where that move fits into the bigger picture.
Higher timeframes can provide important context. They can help you identify major support and resistance, broader trends, and areas where a lower-timeframe setup may have less room to run.
That doesn't mean you need to analyze every timeframe before taking a trade.
It means you should know which higher-timeframe factors could affect the setup you're looking at.
Your entry might come from the 5-minute chart.
But the 4-hour chart might explain why that entry is likely to struggle.
Before taking a trade, ask yourself:
"What does the bigger picture say?"
Sometimes the best way to understand a small move is to zoom out.
The lower timeframe can give you the entry. The higher timeframe can give you the context.
A chart can tell you a lot, but the timeframe you choose can change what you see. Exploring different market perspectives can help you think beyond a single chart or setup.
Explore more market newsletters here:

Detrended Price Oscillator (DPO)
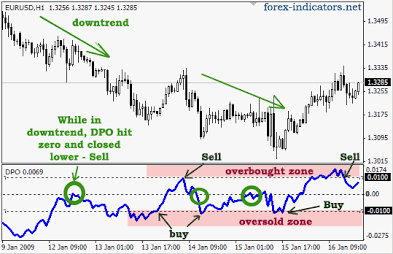
DPO Cycle Oscillations, Overbought/Oversold Bands, and Zero-Line Tests. Source: Forex-indicators.net
The Detrended Price Oscillator (DPO) is a unique technical tool designed to isolate short-term market cycles by mathematically removing long-term trends from price data. Unlike momentum oscillators that track trend continuation, DPO shifts a simple moving average back in time (typically n/2+1 periods) and measures price relative to that historical midpoint. It oscillates above and below a central Zero Line, stripping away macro directional bias to pinpoint exact cycle peaks and troughs.
🔴 The Red Zone (Extreme Positive Peak / Cycle Top)
The Meaning: The DPO line surges high into positive territory above the zero line and forms a distinct rounding peak. Short-term cycle momentum has reached its upper limit relative to its displaced moving average baseline. The Move: Protect profits. The short-term cycle is running out of runway. In a cyclical market, an extended positive reading warns that a cyclical crest is in place and a downward swing is due.
🟡 The Yellow Zone (Hovering Along the Zero Line)
The Meaning: The DPO curve oscillates tightly around the 0.00 baseline, crossing back and forth without establishing clean amplitude. The Move: Hold and wait. The market is in the neutral midpoint of its cycle where neither buyers nor sellers hold a rhythmic edge. Wait for the oscillator to establish distance and hook before entering cycle-based trades.
🟢 The Green Zone (Extreme Negative Trough / Cycle Bottom)
The Meaning: The DPO line plunges deep below the zero line into negative territory and carves out a rounded valley. The short-term down-cycle is bottoming out relative to historical cycle length. The Move: Get ready to buy. Downward cycle momentum is exhausted. When the DPO hooks upward from a deep negative trough and climbs back toward zero, it signals that the next rhythmic bull wave has begun.
🔍 Two Simple Signals to Watch
1. Cycle Length Measurement (Peak-to-Peak / Trough-to-Trough)
DPO is primarily a timing tool rather than a standard overbought/oversold indicator.
- The Logic: Count the number of bars between consecutive DPO troughs or consecutive peaks. If historical troughs consistently print roughly 20 to 22 bars apart, you can anticipate the next cyclical low well in advance, preparing to enter longs as that time window approaches.
2. The Zero-Line Crossover Filter
While extreme peaks and troughs identify cycle extremes, the Zero Line confirms cycle turning points.
- The Logic: A cross above the Zero Line from a negative trough confirms that cycle momentum has officially shifted upward. Conversely, a cross below the Zero Line from a positive peak confirms that the cycle has rolled over into a contraction phase.
💡 The Simple Secret
Think of the DPO as an X-ray that makes the trend invisible to reveal the market's heartbeat. Most indicators get distorted when an asset goes on a massive run, pinning their lines at extreme levels for weeks. DPO completely ignores whether the stock is at $10 or $100—it only cares where the price is relative to the rhythm of its own cycle wave, making it the ultimate tool for timing swings inside larger market trends.

You Don't Feel Tilted. That's the Problem.
Tilt doesn't always look like anger.
Sometimes it looks like being locked in.
You're sitting there focused.
No distractions.
No frustration.
No dramatic revenge trade.
You actually feel sharper than usual.
But look at what you're doing.
Your normal risk is 1%.
Today it's 1.5%.
Your usual setup needs three confirmations.
Today you're taking it after one.
You normally wait for the candle to close.
Today you're clicking halfway through it.
And when someone asks what's wrong, you genuinely don't know.
"I'm fine. I'm focused."
Maybe you are.
Emotionally.
But your behavior is telling a different story.
That's what makes invisible tilt so dangerous.
You don't always notice the emotion first.
Sometimes you notice the consequences first.
Your trades get faster.
Your standards loosen.
Your position size creeps up.
You start making tiny exceptions to rules that were supposed to be firm.
Nothing feels dramatic enough to call "tilt."
Until you look back at the last five trades and realize:
You haven't traded like yourself all morning.
That's the clue.
A trader I knew used to catch himself this way.
He had a simple rule: never risk more after a loss.
One morning, he took a loss.
Nothing unusual.
Then another.
Still calm.
He wasn't angry.
He wasn't shouting at the screen.
But suddenly he found himself taking a slightly larger position on the next setup because, in his words, "This one has a better feel."
That phrase was the giveaway.
His process hadn't changed.
His need to make the morning go a certain way had.
That's tilt.
Not necessarily emotion exploding.
Sometimes it's emotion quietly changing your behavior.
So don't just ask yourself, "How do I feel?"
That's too easy to fool.
Ask better questions:
Am I trading faster than normal?
Am I taking more risk than normal?
Am I bending rules I usually respect?
Am I suddenly desperate for a certain outcome?
Those questions reveal things your mood might hide.
And this is where self-awareness becomes useful.
When your behavior starts drifting, don't wait for the dramatic moment.
You don't need to be furious before taking a break.
Sometimes the smartest move is noticing:
"I'm still calm. But I'm not trading like me."
Then step away.
Reset.
Come back later.
Because real emotional control isn't pretending you're never affected.
It's catching the change before it becomes expensive.
Your feelings can tell you one story.
Your trading records often tell the truth.