US-Iran Peace Deal Cracks
....................................................................................................................


Good Morning,
The U.S. stock market is completely closed today for Juneteenth, but global markets and futures are left nursing a fresh Fed and peace-deal hangover.
Today is Juneteenth National Independence Day in the U.S., meaning the New York Stock Exchange, Nasdaq, and U.S. bond markets are shut down for the federal holiday. But while actual American trading is paused, global investors are working overtime to digest a messy combination of political theater and central bank policy.
Is the U.S.-Iran peace deal starting to crack? Global markets are leaning red as investors heavily question the durability of the newly minted interim agreement. Yesterday, Vice President JD Vance emphasized that the U.S. isn't releasing "a cent of money" to Iran unless they fully comply. Simultaneously, Iran's Supreme Leader stated he only backed the memo after getting strict guarantees to safeguard their "resistance front." With both sides playing tough, S&P 500 futures are sliding 0.6% and Nasdaq futures are down 0.9% in overseas holiday trading.
The Fed dropped a hammer right before the holiday. Right before the long weekend, stocks managed a late-day rally—with the Nasdaq climbing 1.9% and the S&P 500 hitting 7,500—after the Fed finally acknowledged a rate hike is firmly on the table for later this year. While the aggressive stance initially triggered a massive equity sell-off, investors ultimately spun it as a sign of economic stability, helping indices close out the short week in the green.
Europe and Asia are tracking lower. Across the pond, the pan-European Stoxx 600 dipped, dragged down by a huge British deficit spike and a looming leadership challenge against Prime Minister Keir Starmer. Over in Asia, Japan's Nikkei managed a tiny 0.28% gain after matching record highs, while South Korea's Kospi slipped backward after briefly crossing the 9,000 threshold for the first time in history.
It's a quiet but highly anxious Friday in the U.S. The holiday pause gives investors an extended weekend to look past the political posturing before the opening bell rings again on Monday.

🇨🇭 U.S.-Iran Peace Talks in Switzerland Abruptly Called Off after Vance Pullout
Planned diplomatic negotiations in Bürgenstock, Switzerland aimed at cementing a lasting Middle East truce were canceled on Friday after U.S. Vice President JD Vance unexpectedly withdrew from the delegation. While the White House cited highly complex and unpredictable logistics, the sudden cancellation has introduced fresh uncertainty into the durability of the fragile 60-day interim ceasefire agreement.
📉 SpaceX Snaps Three-Day Winning Streak as Post-IPO Profit-Taking Accelerates
SpaceX (SPCX) shares pulled back 7% to $179, breaking a blistering three-day post-IPO winning streak that had briefly driven its valuation past tech behemoths like Amazon and Microsoft. Analysts described the drop as a standard macro-driven cooldown and localized profit-taking rather than any company-specific concern, typical of high-momentum primary market debuts.
🛢️ Oil Registers Deep Weekly Loss as Tankers Resume Strait of Hormuz Transits
Energy markets are locked into a deep weekly decline, with international benchmark Brent crude sliding to $78.31 a barrel and U.S. WTI dropping to $76.14. Despite the immediate friction in the Swiss diplomatic channels, crude futures remain heavily depressed as physical oil tankers successfully begin navigating the newly reopened and blockade-free Strait of Hormuz.
📱 Trump Teases Sovereign Tech Alignment as Apple Partners with Intel on U.S. Fabs
President Trump announced via Truth Social that Apple has finalized a landmark, preliminary agreement to utilize Intel’s domestic foundry network for specialized chip design and manufacturing. The high-profile diversification strategy aims to reduce Apple's acute single-supplier concentration risk with TSMC, instantly sending Intel shares climbing 9% in premarket trade.
🌏 Asian Shares Slide from All-Time Records as Profit-Taking Buffers Regional Rallies
Exchanges across Asia-Pacific reversed early gains on Friday as asset managers locked in profits from blistering, record-shattering rallies in Tokyo and Seoul. The Nikkei 225 dipped 0.6% after logging its fifth consecutive all-time high in morning trade—preserving a massive 7% weekly gain—while South Korea's Kospi retreated 1.8% on the session.
💵 Dollar Soars to 13-Month High as Hawkish Fed Path Squeezes Yen Past 161
The U.S. dollar index surged to a 13-month high of 101.07 after the Federal Reserve's hawkish policy stance prompted currency desks to price in multiple 2026 interest rate hikes. The greenback's aggressive advance pushed the Japanese yen to a multi-decade low of 161.4, slicing deep into the official "red zone" widely seen as the line in the sand for official Tokyo market intervention.
🥇 Gold Plummets 2% as Relentless Greenback Strength Smothers Bullion Demand
Spot gold plunged 1.9% to trade at $4,129 an ounce, while silver shed 3.6% to hit $63.40, marking a painful weekly decline for precious metals. Bullion's traditional safe-haven appeal is being entirely smothered by a combination of plunging global energy overhead costs and a highly aggressive, hawkish interest rate curve under new Federal Reserve Chair Kevin Warsh.

You’re Not Trading With the Same Information
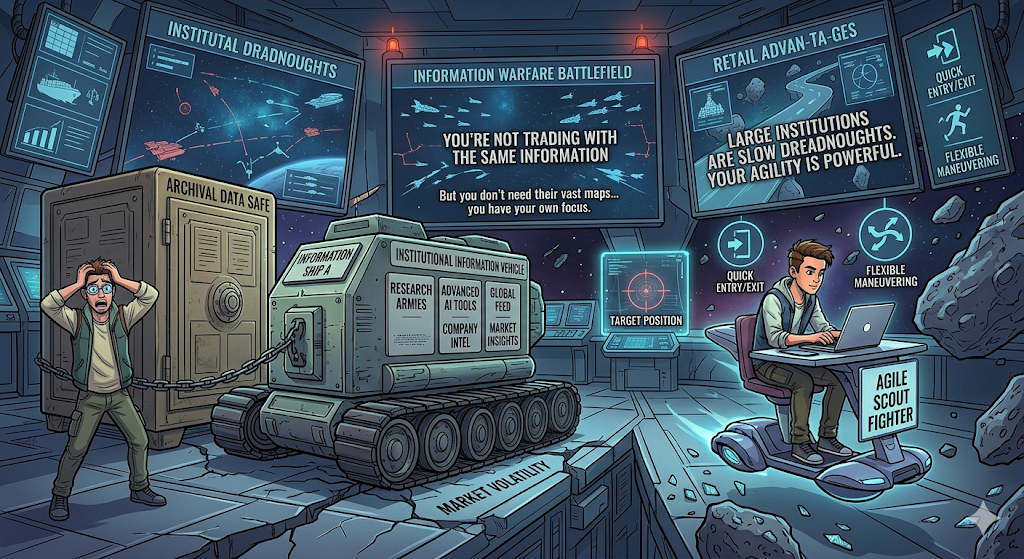
Many retail traders feel like the game is unfair.
Institutions have research teams. Better tools. Faster data. Direct access to company management and deeper market insights.
Meanwhile, you’re trying to make decisions from a laptop.
It’s easy to believe you can’t compete.
But that mindset misses an important point.
You don’t need the same advantages to succeed.
Large institutions have more information, but they also have more constraints. They manage huge amounts of capital. They move slowly. They can’t enter and exit positions as easily as individual traders.
Strong traders stop trying to out-resource institutions. Instead, they focus on what they can control: risk, patience, and execution.
Because your edge doesn’t come from having more information.
It comes from using the information you have better.
When you stop comparing your resources to institutions, your decisions become clearer. You focus less on what you lack and more on building skills that actually matter.
You don’t need to be the biggest player.
You just need a process that works for you.
Some traders like exploring how different market participants think, operate, and find their edge.
If that’s you, you can explore a few market reads here:

Parabolic SAR
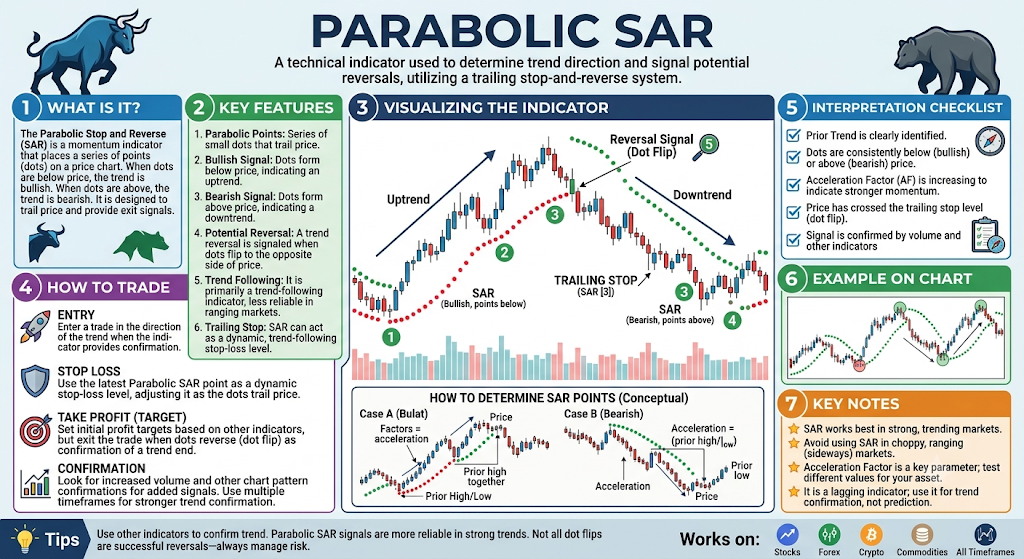
The Parabolic SAR (Stop and Reverse) is a trend-following indicator that shows up as a series of small dots placed either above or below the price bars. It acts like a trailing safety net, pinpointing exactly when a trend is accelerating and when it has officially flipped directions.
🔴 The Red Zone (Dots Above the Price)
The Meaning: The dots are sitting completely above the price bars. This indicates that the market is in a downtrend, and the ceiling is actively pushing the price lower.
The Move: Protect your capital or look to sell. As long as the dots remain on top, the bears are in complete control of the market speed.
🟡 The Yellow Zone (The Dot Flip / Jump)
The Meaning: The price makes a sudden move and physically touches the nearest dot. This causes the indicator to instantly disappear from one side and flip to the opposite side of the price bars.
The Move: Hold and watch. This is the ultimate pivot point. The previous trend has officially ended, and the market is resetting its momentum to start running in the new direction.
🟢 The Green Zone (Dots Below the Price)
The Meaning: The dots are sitting completely below the price bars. This proves that the market is in a healthy uptrend, with a solid floor lifting the price higher.
The Move: Get ready to buy or stay in your long trade. The bulls have successfully captured the momentum advantage.
🔍 Two Simple Signals to Watch
1. The Dot Spacing (The Accelerator)
Pay attention to the distance between each consecutive dot as the trend moves along.
- The Logic: When a trend first flips, the dots start out close together. As the price gains speed, the dots start to space out wider and wider. This shows that the trend is accelerating. If the dots are wide apart, the momentum is fierce; do not try to trade against it.
2. The Sideways Trap
Watch how the dots behave when the price chart is moving completely flat and sideways.
- The Logic: The Parabolic SAR is designed only for trending markets. In a choppy, sideways market, the price will constantly hit the dots, causing them to flip back and forth above and below the price over and over again. This creates false signals (whipsaws), meaning you should ignore the tool entirely until a clear direction emerges.
💡 The Simple Secret
Think of the Parabolic SAR dots as a guardrail that chases the price. As the price moves higher, the floor dots climb higher behind it, but they can never move backward. This makes the tool one of the easiest ways to manage a trailing stop-loss: simply move your safety net to the exact price of the current dot every time a new bar forms.

Your Morning Routine Isn't Saving You

There was a time when trading content convinced everyone that the secret to consistency was becoming a productivity monk.
Wake up at 5 AM.
Cold shower.
Journal.
Meditate.
Read affirmations.
Review yesterday's trades.
Drink something green that tastes like lawn clippings.
Then sit down at your desk feeling like you've unlocked some hidden level of consciousness.
And by 10:07 AM?
You're revenge trading.
Sound familiar?
That's because routines are easy to admire and surprisingly easy to hide behind.
Many traders mistake preparation for transformation.
They believe that because they spent 30 minutes calming their mind, they'll automatically remain calm when a live position goes against them.
Unfortunately, the market doesn't care how mindful you felt at 7 AM.
It only reveals what you've actually practiced under pressure.
The uncomfortable truth is that most trading mistakes don't happen because traders forgot to meditate.
They happen because traders never built a response for the exact moment things get uncomfortable.
The moment when:
"I just took a loss."
"This setup almost worked."
"I need to get back to green."
That's where psychology lives.
Not in the journal.
Not in the breathing exercises.
Not in the inspirational quote you highlighted before breakfast.
Those things can help.
But only if they are connected to a behavioral change.
Otherwise, they become emotional cosmetics.
They make you feel like you're improving without forcing you to confront the habits that keep repeating.
Think about it.
If you journal every morning but still increase your position size after a loss, what exactly changed?
If you meditate daily but still move stops when trades get uncomfortable, did the routine actually reach the part of you that needed work?
Probably not.
Because routines don't rewire behavior by themselves.
Awareness is just the first step.
The harder part is creating a new response when your old patterns show up.
Maybe your next routine shouldn't include another podcast or another gratitude exercise.
Maybe it should include a single question taped to your monitor:
"What do I usually do when I feel uncomfortable — and what will I do differently today?"
That question is less glamorous.
It won't look good in a social media post.
But it might save you far more money than an hour of perfect morning rituals ever will.
Because the goal isn't to become someone who has a beautiful routine.
It's to become someone who behaves differently when the market gives them a reason not to.