The Fed Decides Today
....................................................................................................................


Good morning,
U.S. stock futures are treading water this Wednesday as investors brace for an intense afternoon packed with Middle East airstrikes, an Asia chip sell-off, Big Tech earnings, and a pivotal Fed rate decision.
Wall Street is struggling to find solid direction this morning. Nasdaq futures are edging slightly lower, while S&P 500 futures are up 0.2% and Dow futures are hovering right near the flatline. Traders are trying to balance fresh geopolitical risks with massive earnings reports and the Federal Reserve's big decision later today.
Iran launches a surprise attack, sending oil back up. The brief pause in fighting shattered after Iran launched a surprise attack against U.S. forces, according to U.S. Central Command. The sudden re-escalation pushed Brent crude up over 3% to near $85 a barrel, bringing energy-driven inflation fears right back to the front burner just as central bankers meet.
South Korean chipmakers get hammered again. Over in Asia, the tech sector took another painful hit. South Korea's Kospi index plunged nearly 6%, driven down by a heavy sell-off in memory giants Samsung and SK Hynix. Even though SK Hynix reported a massive 557% jump in quarterly profit, it still fell short of Wall Street's sky-high expectations—igniting fresh fears that the AI hardware boom might be losing steam.
Microsoft and Meta face a "make-or-break" moment tonight. The AI trade faces its biggest test of the week after the closing bell when Microsoft (MSFT) and Meta (META) drop their quarterly results. Following Alphabet's disappointing capital expenditure update last week, investors are hyper-focused on whether these tech giants are spending too much money on AI without showing enough immediate profit. We'll also get key results tonight from Qualcomm, Arm, Starbucks, and Chipotle.
The Fed rate decision lands at 2:00 p.m. ET. Adding to the tension, the Federal Reserve will announce its latest interest rate decision this afternoon. While most traders expect Chairman Kevin Warsh and the Fed to hold rates steady, lingering inflation pressure means the door remains open for a potential surprise rate hike—which would be the central bank's first in three years.

📉 Global Tech Sell-off Spreads to Europe as SK Hynix Disappoints
Semiconductor names led broad equity declines across Asia and Europe on Wednesday following a weak U.S. session. In South Korea, SK Hynix fell 9.61%—after dropping more than 15% intraday—as it missed quarterly estimates despite reporting record revenue and profit. The drag spread to Samsung Electronics (-5%), LG Innotek (-10.89%), and European hardware leaders including ASML (-3.85%) and ASM International (-9.26%).
🇰🇷 South Korea Triggers Record Trading Halts as KOSPI Headed for 35% Monthly Loss
South Korea's equit sell-off deepened as missed earnings targets from memory giants fueled growing anxiety over the sustainability of artificial intelligence spending. The benchmark KOSPI index dropped as much as 9.8%, triggering circuit breakers for a second consecutive day, putting the index on track for a record monthly decline of roughly 35%.
💻 SK Hynix’s Record Profit Misses High Market Expectations
SK Hynix Inc. reported a 557% jump in quarterly profit, but the surge fell short of elevated consensus estimates. The miss has exacerbated growing institutional fears that the rapid pace of global AI hardware expansion may be entering a near-term deceleration phase.
🚗 Ford Stock Rises on Beat-and-Raise Quarter and Upbeat Guidance
Ford (F) shares climbed Wednesday after the automaker beat second-quarter expectations and raised its full-year guidance. Executive leadership pointed to strong pricing power, an improved vehicle mix, and net tariff exposure management as key drivers behind the profit expansion.
🥇Gold Holds Near $4,020 as Oil Rebound and Fed Uncertainty Weigh
Spot gold hovered near $4,020 per troy ounce during Asian trading, extending a subdued run for a second session. U.S. interceptions of Iranian missiles lifted crude oil prices and inflation concerns, while money markets priced in a 30.5% chance of an immediate Fed rate hike and a 76.6% probability of a September increase, raising borrowing cost expectations.
📊 Global Stocks Muted as Traders Await Fed Decision and Tech Results
Global shares struggled for direction on Wednesday ahead of the Federal Reserve's policy verdict and key megacap earnings. Mild advances in Europe and U.S. index futures did little to lift overall sentiment after South Korea's KOSPI plunged nearly 6%, following a 10% drop in the prior session driven by high-valuation tech fatigue.
₿ Bitcoin Pierces $63K as Asian Semiconductor Contagion Hits Wall Street
Bitcoin and broader digital asset markets faced downside pressure as the sell-off in Asian tech equities crossed over to Wall Street. The premier cryptocurrency broke below the $63,000 level as institutional investors reduced risk exposure across asset classes amid the semiconductor drawdown.

Five Trades Doesn't Always Mean Five Risks
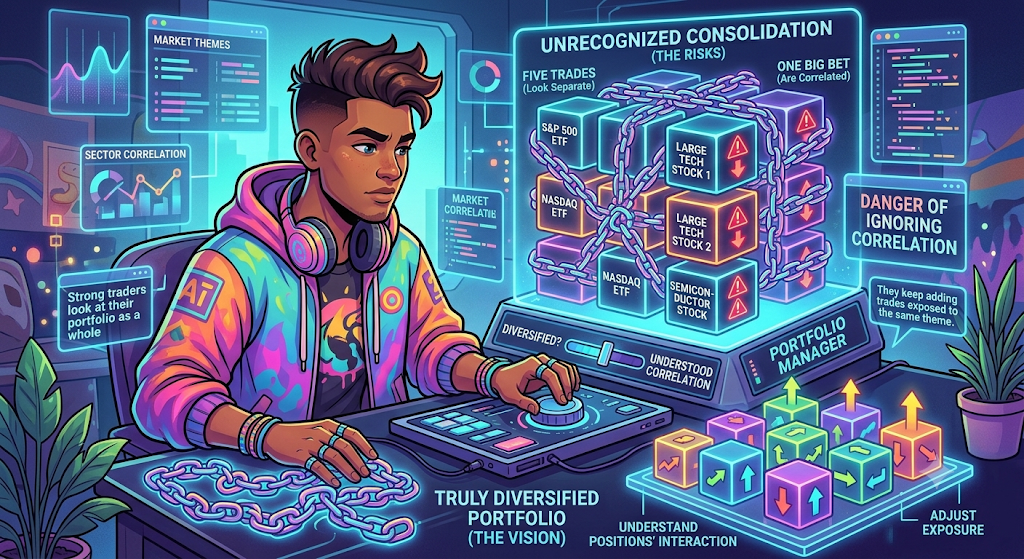
You buy an S&P 500 ETF.
Then you buy a Nasdaq ETF.
Later, you add a few large tech stocks.
It feels like you've diversified.
But have you?
When markets fall, those positions may all move in the same direction. What looked like several independent trades is really one big bet.
That's the danger of ignoring correlation.
Many traders focus on each position individually but never ask how those positions interact. They keep adding trades that are exposed to the same market theme, sector, or event without realizing how much risk they're accumulating.
Strong traders look at their portfolio as a whole. They understand which positions are likely to move together and adjust their exposure accordingly. Sometimes the smartest trade isn't adding another position.
It's recognizing you already have enough.
Because diversification isn't about the number of trades you have.
It's about how different those trades really are.
When you understand correlation, you stop counting positions and start managing total risk.
That's how disciplined traders stay in control.
Some of the best trading insights come from understanding how markets, sectors, and asset classes interact—not just individual trades.
If you'd like to explore more market perspectives, you can discover a few newsletters here:

The Rounding Top
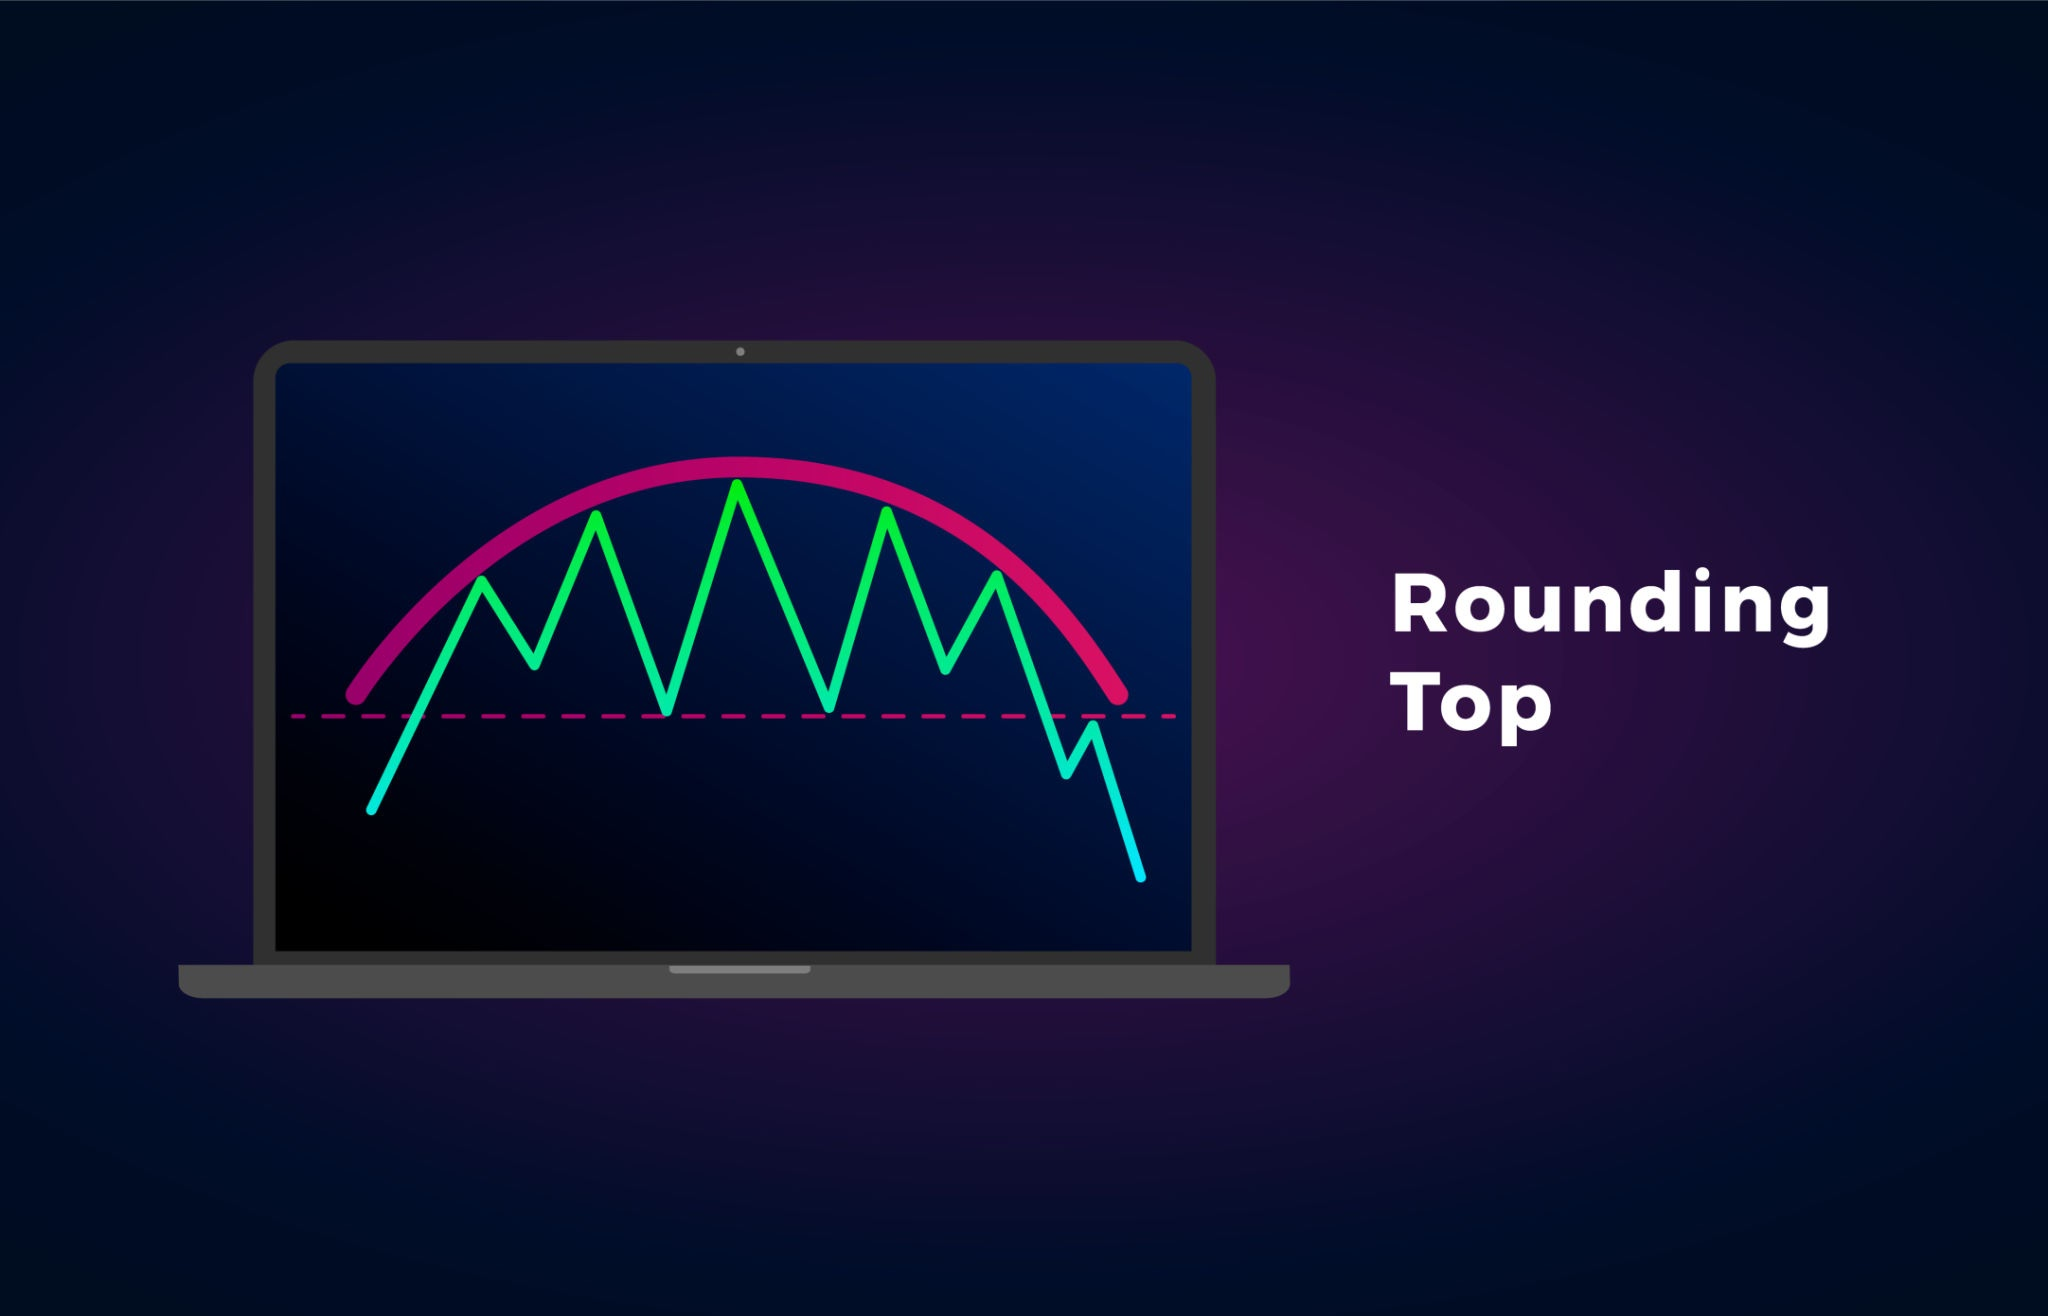
Rounding Top Reversal Structure. Source: BestForBest / Getty Images
The Rounding Top (often called an Inverted Saucer) is a long-term bearish reversal chart pattern that resembles an upside-down "U" shape or a dome. It signals a gradual shift from an extended upward trend to a sustained downward trend. Rather than a sharp double top or spike, a Rounding Top represents a slow, subtle transition where buyers gradually lose steam and sellers quietly take over momentum.
🔴 The Red Zone (The Inverted Dome Crest)
The Meaning: The upward rally slows down and price moves in a smooth, rounded arch across the top. Buyers can no longer make sharp new highs, and the market enters a subtle phase of institutional distribution.
The Move: Exercise extreme caution. The buying power is completely exhausted. Avoid opening new long positions here, as the ceiling has flattened out and momentum is shifting downward.
🟡 The Yellow Zone (The Downward Curve)
The Meaning: The price begins to curve downward along the right side of the dome. Rallies become weak and shallow as supply steadily outweighs demand.
The Move: Watch closely. The market is sliding toward the support floor (the Neckline) that sits at the base of the dome. Prepare your short strategies or tighten your stop-losses on any remaining long positions.
🟢 The Green Zone (The Neckline Breakdown)
The Meaning: The price drops to the horizontal support line (the Neckline) formed at the start of the pattern and breaks cleanly below it.
The Move: Go! A clean break and close below the horizontal support line is your official confirmation signal to short or exit. It confirms that the dome is complete and a major downward trend has officially begun.
🔍 Two Simple Signals to Watch
1. The Inverse Volume Curve
In a classic Rounding Top, volume often forms an inverted U-shape or a asymmetric curve.
- The Logic: Volume tends to be high during the initial rise, dries up to very low levels at the flat peak of the dome (showing a lack of buying enthusiasm), and picks up heavily as the price starts sliding down the right side toward the breakdown.
2. The Neckline Retest
After dropping below the support floor, the price frequently makes a weak, temporary bounce back up to touch that broken floor.
- The Logic: The old support floor flips into a heavy new ceiling. A failed bounce off this line provides an exceptionally safe, low-risk entry point for a short trade.
💡 The Simple Secret
Think of the Rounding Top as a roller coaster reaching the top of a hill. The car loses upward speed, levels out flat at the peak, and then slowly starts rolling downhill before gravity takes over completely. To calculate your target price after a breakdown, measure the maximum vertical height from the lowest support line up to the top of the dome—the price will very often drop that exact same distance downward once the floor breaks.

You Expected in Six Months What Takes Most Traders Six Years

One of the biggest lies in trading isn't about indicators.
It isn't about market makers.
It isn't about secret strategies.
It's the timeline.
Social media has convinced people that becoming consistently profitable is a short project.
"Three months to six figures."
"Quit your job in 90 days."
"I turned $500 into $50,000."
You see enough of those headlines and, without realizing it, you create an invisible deadline for yourself.
"By this time next year, I should have figured it out."
Then reality shows up.
Six months later, you're still making mistakes.
Still breaking rules.
Still wondering why consistency feels so far away.
Instead of thinking,
"Maybe this skill just takes longer to master..."
You start thinking,
"Maybe I'm just not cut out for trading."
That's a painful conclusion to reach...
...especially when it's based on a completely unrealistic expectation.
Think about it.
Nobody expects to become a surgeon after watching a few YouTube videos.
Nobody expects to master chess in a summer.
Nobody picks up a guitar and gets frustrated because they can't play like a concert musician after three months.
Yet somehow, people expect to compete in one of the most psychologically demanding professions in the world after a handful of courses and a few hundred trades.
It doesn't make sense.
Trading isn't just learning charts.
You're learning how you behave under pressure.
How you respond to uncertainty.
How you manage fear, greed, boredom, overconfidence, disappointment, and impatience.
That kind of education doesn't happen over a weekend.
It happens one mistake at a time.
One journal entry at a time.
One painful lesson at a time.
The traders who last aren't always the smartest.
They're often the ones who stopped asking,
"Why am I not there yet?"
...and started asking,
"What skill am I building right now?"
That's a completely different mindset.
Because an edge isn't something you download.
It's something you slowly earn.
Trade after trade.
Month after month.
Sometimes year after year.
And yes, that can feel frustrating.
But here's the good news.
If you're still showing up, still learning, still refining your process...
You're probably much closer than you think.
Not because success is just around the corner.
But because real edges are built quietly.
There's no dramatic moment where the market announces you've finally "made it."
One day you'll simply notice that the mistakes that used to define you...
...have become mistakes you rarely make anymore.
And that's when you'll realize something important.
You weren't behind.
You were just expecting a lifelong skill to develop on a social media timeline.