Microsoft Rockets Over 15%
....................................................................................................................


TGIF!
Wall Street is heading into the weekend on a high note, putting on a strong green performance. Nasdaq futures are surging 1.2%, S&P 500 futures are up 0.4%, and Dow futures are gaining roughly 0.6%. A wave of relief is sweeping across trading floors after stellar tech earnings and a record-breaking overnight rally in Asia restored full confidence in the artificial intelligence boom.
South Korea’s market roars back with a historic 14% surge. Setting a frantic bullish tone for global markets overnight, South Korea’s Kospi index skyrocketed 14%, forcing automatic trading halts as buyers rushed back into memory chip giants. The massive Asian bounce laid the groundwork for U.S. stock futures to extend their gains this morning.
Big Tech earnings deliver an AI-driven supercharge. Following Microsoft’s historic 15% rally earlier in the week, Thursday’s post-bell earnings from the remaining tech giants offered a mixed but overall triumphant picture for the AI trade:
- Amazon (AMZN) jumped 10% in premarket trading after easily beating earnings expectations, driven by rapid expansion in its custom chip business and cloud infrastructure.
- Apple (AAPL) bucked the trend, dropping 7% after missing expectations on China revenue and Services growth.
The $700 billion+ AI spending promise. Any fear that tech companies would pull back on infrastructure investment has been completely shattered. The four major hyperscalers—Amazon, Microsoft, Meta, and Alphabet—are now officially forecasting cumulative 2026 capital expenditures of $720 billion to $745 billion. This massive commitment assures investors that the AI hardware cycle is nowhere near slowing down.
Oil eases while energy giants prepare to report big windfalls. On the geopolitical front, crude prices are finally cooling off slightly as maritime traffic through the Strait of Hormuz begins to slowly pick up. Brent crude slipped below $86 a barrel and U.S. crude settled near $82. Despite the minor pullback, oil titans ExxonMobil and Chevron are scheduled to post massive Q2 earnings windfalls today, having benefited directly from weeks of war-driven energy spikes.
It’s a triumphant, tech-led Friday. The AI hype train is back on the tracks with mass

🚀 Microsoft Rockets Over 15% in Record Single-Day Market Value Surge
Microsoft (MSFT) surged 15.5% to record the largest single-day market-value gain in stock market history after posting fourth-quarter earnings that beat Wall Street expectations. The historic rally effectively reverses a year-long stretch of lagging performance driven by investor concerns over heavy artificial intelligence spending and delayed returns on investment.
📦 Amazon Soars 12% Premarket as AWS AI and Chip Units Hit $25B Run Rate
Amazon (AMZN) shares jumped 12% in premarket trading on Friday after delivering second-quarter top- and bottom-line beats. Investor sentiment was further boosted as management revealed that both AWS's artificial intelligence division and its custom chip hardware segment have eclipsed $25 billion annualized revenue run rates.
🛢️ Oil Benchmarks Head for 20% Monthly Surge Despite Recent Pullback
Global crude oil prices are on track to lock in substantial weekly and monthly gains despite easing lower over the past couple of days. On a monthly basis, both international Brent crude and West Texas Intermediate (WTI) have gained close to 20% as underlying supply risks keep energy market valuations elevated.
📱 Apple Slides 7% Premarket as Sluggish China and Services Drag Q3 Beat
Shares of Apple (AAPL) fell more than 7% in premarket trading despite posting third-quarter earnings of $2.02 per share on $109.4 billion in revenue. Although strong iPhone sales helped top headline estimates, the stock faced heavy selling pressure after sales across Greater China and the Services division fell short of consensus targets.
🎮 Sony Raises Annual Profit Guidance to $7.5B on Gaming Growth and Weak Yen
Sony elevated its full-year net income projection on Friday to 1.21 trillion yen ($7.5 billion), up from its previous 1.16 trillion yen forecast. The Japanese electronics giant credited outsized momentum in its PlayStation video game unit alongside favorable foreign exchange tailwinds from a sustained weak yen.
🇰🇷 SK Hynix and Samsung Skyrocket Over 20% as AI Chip Rally Roars Back
South Korean memory titans SK Hynix and Samsung Electronics soared more than 20% on Friday to log their best single-day gains. The massive regional rebound closely tracked an overnight surge across U.S. technology equities, highlighted by an 8% jump in the iShares Semiconductor ETF (SOXX).
₿ Bitcoin Rally Stalls at $64K Following Massive $9.6B Options Expiry
Bitcoin’s price recovery hit a wall near the $64,000 baseline following the settlement of 149,000 option contracts valued at $9.6 billion. Despite call-heavy monthly positioning overall, low implied volatility and uneven ETF capital flows kept the digital token consolidated around its max-pain level.

More Markets Don't Always Mean More Opportunities

Stocks. Forex. Crypto. Commodities. Options.
Everything is moving.
So you try to trade all of them.
At first, it feels like you're increasing your chances of finding great setups.
In reality, you're dividing your attention.
Every market has its own rhythm. Different trading hours. Different drivers. Different risks. The more markets you try to follow, the harder it becomes to understand any one of them well.
Many traders mistake being busy for being productive. They jump from one chart to another, afraid they'll miss the next big move.
Strong traders know that focus is an edge.
They specialize. They learn how a market behaves. They understand its patterns, its volatility, and the events that move it. Instead of knowing a little about everything, they know a lot about what they trade.
Because you don't need to catch every opportunity.
You only need to recognize the right ones.
The market rewards depth more than breadth.
Every market has its own lessons to teach. Reading different perspectives can help you better understand the forces driving the assets you trade.
You can explore a few market newsletters here:

Williams %R
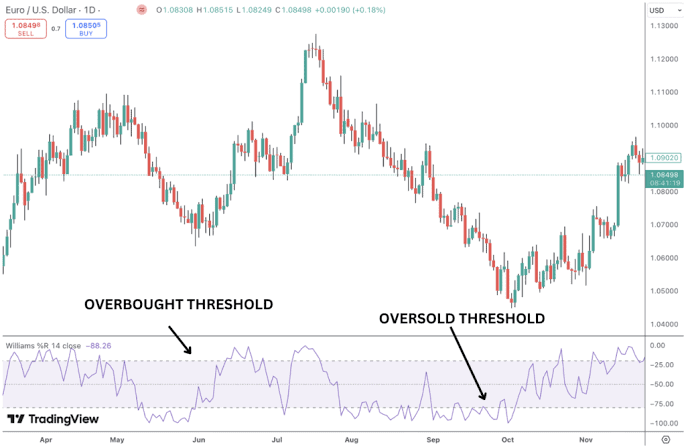
Williams %R Overbought and Oversold Thresholds. Source: Alchemy Markets
The Williams %R (or Williams Percent Range) is a fast-acting momentum oscillator developed by Larry Williams. It moves between 0 and -100 to measure where an asset’s current closing price is relative to the highest high over a given period (typically 14 periods). Because it uses an inverted negative scale, the top of the chart represents overbought territory, while the bottom represents oversold territory.
🔴 The Red Zone (Above -20 / Overbought)
The Meaning: The Williams %R line travels near the top of the indicator, climbing between 0 and -20. This shows that the price is trading near the peak of its recent 14-period range.
The Move: Exercise caution. The market is overbought, meaning the upward move is getting stretched. Watch for the indicator line to turn downward and cross back below -20 as your signal that buyers are losing control and a pullback is starting.
🟡 The Yellow Zone (-20 to -80)
The Meaning: The Williams %R line travels inside the neutral middle zone between -20 and -80, moving around the central -50 level.
The Move: Hold and wait. The price is moving comfortably within its recent high-low boundaries without extreme momentum on either side. There is no clear overextended edge to exploit.
🟢 The Green Zone (Below -80 / Oversold)
The Meaning: The Williams %R line drops near the bottom of the indicator, sinking between -80 and -100. This reveals that the price is trading near the bottom of its recent 14-period range.
The Move: Get ready. The market is heavily oversold from aggressive selling pressure. Look for the line to hook upward and cross back above -80 to confirm that buyers are stepping back in for a rebound.
🔍 Two Simple Signals to Watch
1. The Threshold Crossover Exit
Never enter a trade purely because the line touches -80 or -20—wait for it to pop back out.
- The Logic: An asset can remain overbought (above -20) or oversold (below -80) for extended periods during a powerful trend. The actual trigger happens when the indicator line exits the extreme zone: crossing above -80 generates a buy signal, while crossing below -20 generates a sell signal.
2. The Failure Swing (Momentum Loss)
Watch how the line behaves when it tries to return to an extreme zone during a pullback.
- The Logic: In a strong uptrend, if Williams %R drops into oversold territory (below -80) but during the next push upward fails to reach above -20, it shows that buying momentum has severely weakened. This "failure swing" acts as an early warning of an impending trend reversal.
💡 The Simple Secret
Think of Williams %R as a rubber band inverted upside down. Because it measures the close relative to the highest high, values near 0 mean the price is pressing right against the ceiling, while values near -100 mean it is resting on the floor. Its key advantage over other oscillators is its speed: Williams %R frequently hits its extreme turns 1 to 2 periods before the price chart itself changes direction, making it an excellent leading indicator for short-term reversals.

You Trusted the Setup... Just Not Enough
A trader once said something that stuck with me.
"My biggest losing trades don't bother me anymore."
"It's the winners I barely participated in that haunt me."
I knew exactly what he meant.
The setup was textbook.
It matched the plan.
You'd taken trades like it before.
You knew the probabilities.
But when it came time to click the button...
Something inside you hesitated.
"Maybe I'll just go half size."
"Let's keep it small... just in case."
The trade takes off almost immediately.
It hits your target.
Everything worked exactly as planned.
Instead of feeling proud...
You feel annoyed.
Not because you lost money.
Because you didn't trust yourself enough to take the opportunity you had spent weeks preparing for.
Now comes the dangerous part.
The next trade appears.
This time you're frustrated.
"I'm not missing another one like yesterday."
So you increase your size.
Except this setup isn't nearly as good.
And, of course...
This one loses.
Do you see the pattern?
You trade your best ideas with fear...
...and your emotional reactions with confidence.
That's backwards.
Here's the truth most traders don't want to hear:
Position sizing isn't just about risk.
It's about self-trust.
If your trading plan says a setup deserves full size, but your emotions keep talking you out of it, then the real problem isn't your strategy.
It's the relationship you have with your own process.
Now, don't misunderstand this.
I'm not saying you should increase your size every time you feel nervous.
Sometimes smaller size is exactly the right decision, especially when you're testing something new or navigating unusual market conditions.
But if you're consistently under-sizing your highest-quality setups because you're afraid they'll fail...
...you're training yourself to doubt your own edge.
And that doubt has a cost.
Not just financially.
Psychologically.
Because every winner you undertrade reinforces the belief that you'll never be satisfied.
The answer isn't to force yourself into bigger positions overnight.
The answer is much simpler.
Define your sizing before the market opens.
Decide what a high-quality setup earns.
Decide what an average setup earns.
Then let the plan make the decision—not your emotions in the heat of the moment.
Remember, confidence isn't proven by taking oversized risks.
It's proven by giving your best opportunities the respect they deserve.
Because one of the most frustrating feelings in trading isn't watching a good trade lose.
It's watching a great trade win...
...while you stood on the sidelines, convincing yourself you were being "careful," when in reality, you were just afraid to trust the work you'd already done.