US Bulls are Back
....................................................................................................................


Good morning.
The market is sniffing out a deal, and it smells like a record high.
After a massive Tuesday where the S&P 500 surged 1.18%, we’re starting Wednesday morning in a holding pattern. Futures are trading mostly flat, but don't let the lack of movement fool you—the S&P is now less than 1% away from its all-time peak of 7,002.28. If the bulls can find one more reason to run today, we’re looking at a brand-new milestone.
Is the "Iran Deal" finally real? Investors are betting big on a diplomatic breakthrough. President Trump teased on Monday that the "other side" is desperate for a deal, and word from the White House is that a second round of talks in Pakistan could happen in the next 48 hours. The market is so optimistic that Monday’s rally wiped out all the "war losses" dating back to February. Even with the Strait of Hormuz still a hot zone, the narrative has shifted from "obliteration" to "negotiation."
Earnings season is hitting its stride. While we wait for the 9 p.m. news cycle, the "Big Banks" are taking center stage this morning. Bank of America, Morgan Stanley, and PNC all report before the bell, alongside chip giant ASML. These reports will tell us if the corporate world is actually as resilient as the stock charts suggest, or if the "war fog" has started to eat into the bottom line.
But keep an eye on the "Inflation Monster." We’re getting fresh data on import and export prices today, which will show us just how much that recent oil spike is still bleeding into the economy. As one CIO put it, "We aren't done with this conflict yet," and with the S&P sitting on its 9th green day in the last 10, the "air" at the top is getting pretty thin.
We’re at the doorstep of a record, but with high-stakes earnings and a potential peace deal hanging in the balance, the next few hours are going to be loud.

📈 S&P 500 Nears Record High as War Losses Are Erased
U.S. stock futures held steady Wednesday morning after the S&P 500 surged to within 1% of its 7,002.28 all-time high. A powerful rally has seen the index finish positive in nine of the last 10 sessions, effectively erasing all market losses incurred since the Iran conflict began in late February.
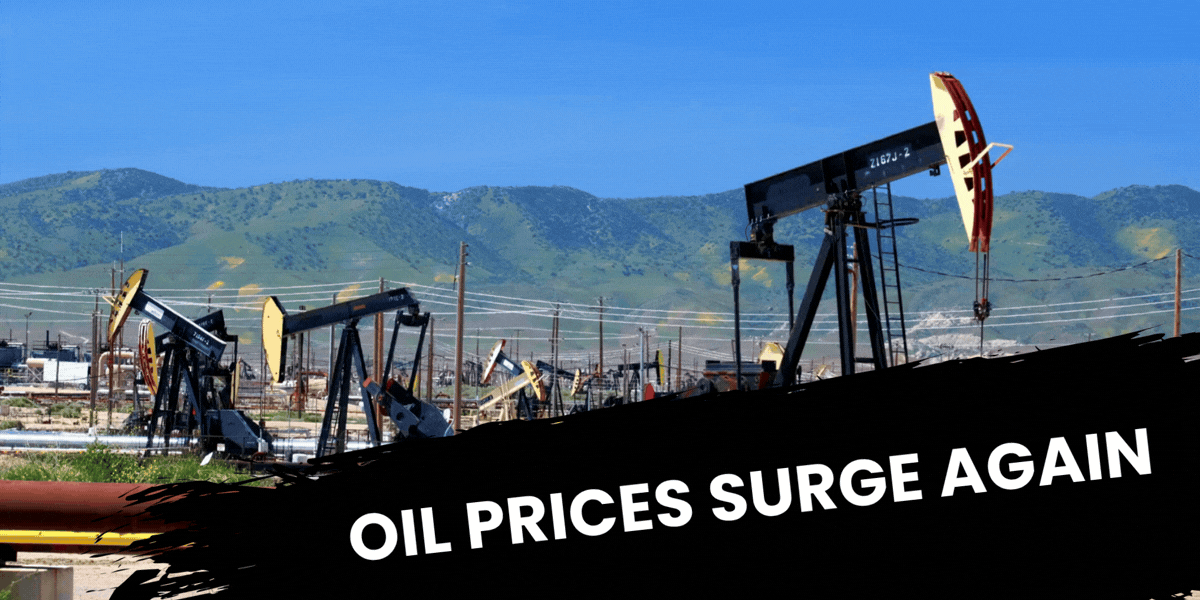
🛢️ Oil Swings as Trump Signals Return to Peace Talks
Crude prices fluctuated Wednesday as traders weighed a "double blockade" of the Strait of Hormuz against President Trump’s comments that the war is "very close to over." Brent traded below $95 a barrel following a 4.6% drop Tuesday, buoyed by reports that diplomatic talks could resume in Pakistan within 48 hours.
👜 Luxury Stocks Sink as War Hits Gucci and Hermes
Luxury giants fell to the bottom of the Stoxx 600 after earnings reports revealed the heavy toll of the Middle East conflict. Hermes shares sank 14% despite overall growth, while Kering flagged an 11% retail revenue drop in the Middle East as Gucci sales continue to underperform.
🥇 Gold Steadies Near 1-Week High Awaiting Clarity
Spot gold held firm at $4,841.76 per ounce, hovering near its highest level since April 8. Investors remain on the sidelines, maintaining positions in the precious metal as they await definitive news on whether the next round of U.S.-Iran negotiations will yield a permanent ceasefire.
₿ Bitcoin Hits $75K on Bets of "Short-Lived" Blockade
Bitcoin defied oil-driven inflation fears to surge above $75,000, as analysts suggest the move signals a growing belief that the U.S. blockade of Iranian ports will be brief. The digital asset's climb mirrors the aggressive rebound in U.S. equities as risk appetite returns to the market.
💵 Dollar Slumps to 6-Week Low as Safe-Haven Demand Fades
The U.S. dollar has surrendered nearly all gains made since the start of the war, drifting toward a six-week low. Hopes for a diplomatic breakthrough have triggered a massive unwind of safe-haven positions, resulting in seven consecutive days of losses for the greenback.
🌏 Asian Shares Scale 6-Week Peak on Pakistan Summit Hopes
Indices across Asia-Pacific tracked Wall Street’s overnight rally to reach their highest levels in over a month. Sentiment was bolstered by President Trump’s confirmation that peace talks could resume in Pakistan, offsetting the immediate economic anxiety caused by the ongoing Hormuz restrictions.

Your Platform Can Fail — Your Plan Shouldn’t
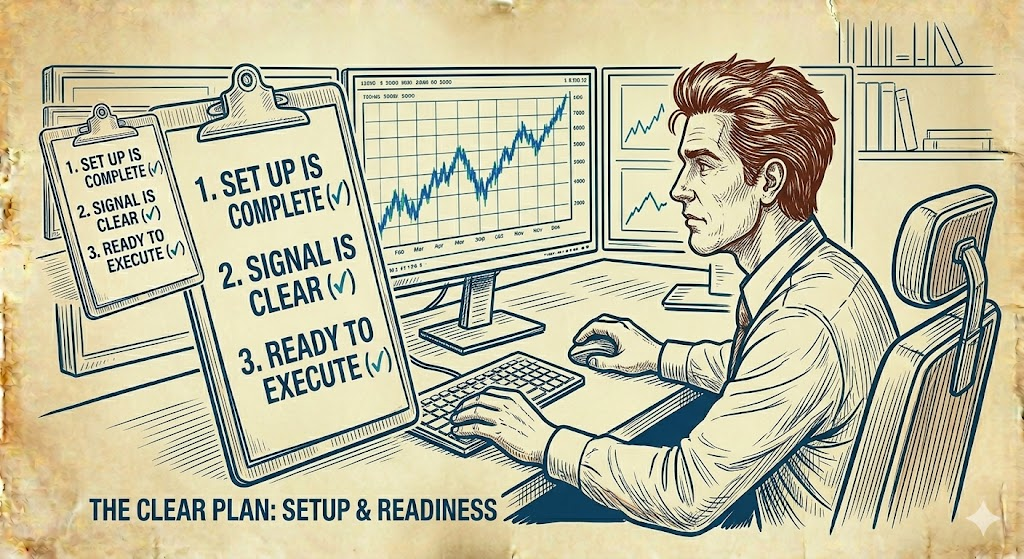
Everything looks clear. The setup is there. You’re ready to execute.
Then the platform freezes.
Price keeps moving. Orders lag. Data pauses. And suddenly, the moment you planned for becomes chaotic.
This happens more often during high volatility. The exact time execution matters most is when systems get stressed.
That’s where many traders get caught off guard.
They rely fully on one platform. One connection. One execution path. When it fails, there’s no backup. Decisions become rushed. Mistakes follow.
Strong traders plan for this.
They avoid overtrading during unstable conditions. They reduce risk around major news. They have clear rules for when not to trade if execution is unreliable.
Because control matters more than opportunity.
When you accept that platforms are not perfect, you trade with more awareness. You protect yourself from situations where execution is out of your hands.
Some traders like learning how others handle real-world trading challenges and adapt to market conditions.
If that’s you, you can explore a few market reads here:

MACD Histogram
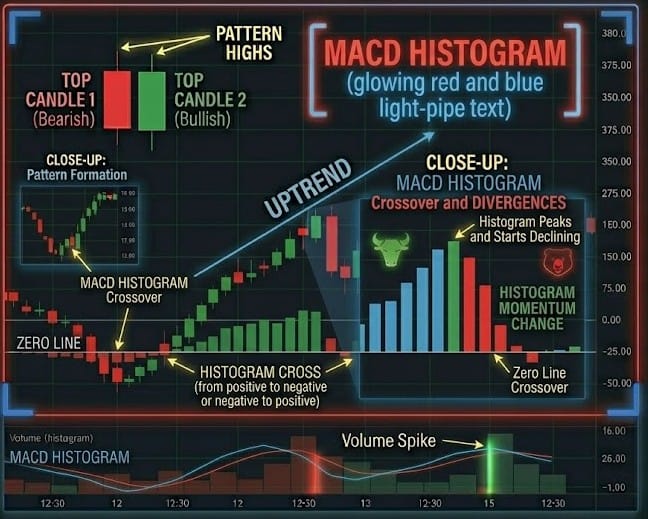
While the standard MACD lines show trend direction, the Histogram measures the distance between the MACD line and the Signal line. It visualizes the speed of price movement. It is the "accelerometer" of the trading world—it tells you not just that you are moving, but whether you are speeding up or slowing down.
🛠️ The Strategy Logic
Use these logical triggers to identify when a trend is losing steam before the price actually turns:
- IF: The Histogram bars are above the zero line and growing taller...
- THEN: Bullish momentum is accelerating. The gap between the MACD and its signal is widening, suggesting the current uptrend is strong and healthy.
- THEN: Bullish momentum is accelerating. The gap between the MACD and its signal is widening, suggesting the current uptrend is strong and healthy.
- IF: The Histogram bars are above zero but start getting shorter (sloping toward zero)...
- THEN: The uptrend is "losing momentum." This is an early warning. The price might still be rising, but the strength of the move is fading, often preceding a bearish crossover of the main lines.
- THEN: The uptrend is "losing momentum." This is an early warning. The price might still be rising, but the strength of the move is fading, often preceding a bearish crossover of the main lines.
- IF: Price makes a new high, but the Histogram makes a lower high (Bearish Divergence)...
- THEN: You have a high-probability "Exit" or "Short" signal. This proves that the latest price surge was "weak" and lacked the internal force of the previous peak.
- THEN: You have a high-probability "Exit" or "Short" signal. This proves that the latest price surge was "weak" and lacked the internal force of the previous peak.
- IF: The Histogram bars cross from below zero to above zero...
- THEN: A momentum shift is confirmed. This represents the exact moment the MACD line crosses its Signal line, often used as the "Trigger" for a long entry.
- THEN: A momentum shift is confirmed. This represents the exact moment the MACD line crosses its Signal line, often used as the "Trigger" for a long entry.
- IF: The Histogram shows a "Double Bottom" below the zero line while price is falling...
- THEN: Selling pressure is "Bottoming Out." If the second low on the histogram is higher than the first (Bullish Divergence), a violent V-shaped recovery is likely around the corner.
💡 Pro Tip
The "Slant" Secret: Don't wait for the zero-line cross to manage your trades. The change in the slope of the histogram is your fastest indicator.
If you are long and the histogram bars stop growing and "tick down" for two consecutive sessions, take partial profits.
This "rounding over" effect happens significantly earlier than the actual MACD crossover, allowing you to bank gains while the "late crowd" is still buying the top.

You Cut It Early Again

You planned the trade well.
Entry made sense.
Stop was clean.
Target gave you a solid risk-to-reward.
On paper, everything was right.
Then price starts moving your way.
Not exploding… just grinding.
Getting closer to your target.
And that’s when the noise starts in your head:
“Take it now.”
“It’s close enough.”
“What if it turns?”
So you close it.
Small win. Safe. Feels fine… for a second.
Then price keeps going.
Straight to your original target.
Now it hits.
That’s when it stings.
Because nothing was wrong with the trade.
You just didn’t stay in it.
This is where a lot of traders quietly mess themselves up.
They think they have a solid system because their setups look good.
But in reality?
They’re not trading the plan — they’re editing it mid-trade.
And it adds up.
You take full losses when you’re wrong.But when you’re right… you take half.
Or less.
That math doesn’t work.
Not over time.
It feels like you’re being smart.
Being cautious.
But most of the time, it’s just discomfort.
You don’t want to watch profit pull back.
You don’t want to risk being “almost right.”
So you cash out early.
Here’s the part most people won’t say:
If your target made sense before the trade…it shouldn’t suddenly feel wrong just because price is getting close.
Nothing changed.
Just your emotions.
Good traders aren’t the ones who always pick the best entries.
They’re the ones who can sit through that last stretch without interfering.
Because that’s where the actual edge is.
Not in drawing clean setups.
In letting them finish.