Dell Explodes 40% Higher
....................................................................................................................


Good Morning,
Dell is putting on an absolute masterclass, and the market is riding a wave of ceasefire hope.
We’re kicking off Friday morning with stock futures edging up 0.1% across the board. The S&P 500 and Nasdaq are looking to extend a massive winning streak, having notched brand-new record highs for three straight days. The bulls are in total control, powered by a massive AI blowout and the promise of a diplomatic breakthrough.
Dell just blew the doors off Wall Street. After the closing bell, Dell dropped a monster earnings report that sent its stock skyrocketing close to 40% in premarket trading. Their AI server sales grew an unbelievable 757%, proving that data centers are buying up Nvidia-powered hardware at a breakneck pace. It’s a loud reminder that the AI buildout is moving faster than anyone expected.
The peace deal is reportedly sitting on Trump's desk. Stock indexes have been rallying ever since the White House hinted that negotiations with Iran are in the "final stages." Word on the street is that a 60-day ceasefire extension has officially been drafted. Investors are desperate for this to be signed because reopening the blockaded Strait of Hormuz is the only way to kill off the sticky inflation that's been making the Fed twitchy about interest rates.
It’s an "all-systems-go" Friday. If the official ceasefire update drops today, this record-breaking rally could get a whole lot louder by the closing bell.

🛢️U.S. and Iran Reach Tentative 60-Day Truce Renewal Pending Trump Signoff
The United States and Iran have reached a critical tentative agreement to extend their ceasefire by 60 days and establish a framework for broader negotiations regarding Tehran's nuclear program. While the deal still awaits final approval from President Trump, the diplomatic breakthrough has significantly raised hopes that the three-month conflict is nearing a resolution.
📉 Oil Set for 19% Collapse in May as Truce Optimism Wipes Risk Premium
Global energy prices tumbled on the news of the 60-day ceasefire extension, putting international benchmark Brent crude on track for a massive 19% collapse in May—its steepest monthly decline since 2020. Traders are aggressively unwinding geopolitical hedges on optimism that maritime commercial flows through the vital Strait of Hormuz will swiftly resume.
💻 Oracle Skyrockets 7% as Snowflake Earnings Defuse "SaaSpocalypse" Fears
Shares of Oracle (ORCL) jumped 6.9% following a blockbuster earnings report from Snowflake, providing strong evidence that the devastating "SaaSpocalypse" selloff has been overdone. The broader software sector has shed $2 trillion in market value since late 2025 on fears that AI would displace subscription models, but cloud platforms sitting at the center of AI workflows are proving highly resilient.
🚀 SpaceX Safely Moderates June IPO Target to $1.8 Trillion Valuation
As Elon Musk’s commercial spaceflight and intelligence venture nears its highly anticipated public debut next month, sources say SpaceX has adjusted its IPO valuation goal to a baseline of $1.8 trillion. The calibrated target aims to ensure a smooth market entry as institutional funds prepare for the largest primary listing of the decade.
🖥️ Dell Shares Explode 40% Higher on Massive AI Server Demand Beat
Dell Technologies (DELL) shares skyrocketed nearly 40% in extended trading after releasing an annual sales guidance that vastly outperformed Wall Street consensus. The infrastructure hardware provider is seeing an absolute deluge of corporate and hyperscaler orders for its high-margin server lines optimized to run complex AI training workloads.
🌏 Asian Indices Defy Geopolitical Turmoil to Hit All-Time Highs
Exchanges across Asia-Pacific rallied furiously on Friday, tracking record-breaking sessions from New York. South Korea's Kospi leaped over 3% to map a fresh intraday record of 8,476.15, while Japan's Topix comfortably climbed 1.41% to scale its own historic peak of 3,957.17 as regional investors completely uncoupled tech growth from localized border skirmishes.
🤖 Nvidia Directs $6.5B into Photonics to Break AI Infrastructure Bottlenecks
Nvidia has deployed a massive $6.5 billion war chest into specialized startups working on photonics—the science of using light waves instead of electricity to transmit computing data. The chip titan is moving aggressively to scale light-based architecture in an effort to eliminate data-transfer lag, which has emerged as a primary bottleneck for distributed AI clusters.

What Worked Last Year Might Not Work Now
Many traders assume the market will keep behaving the same way.
The same setups. The same reactions. The same environment.
Then suddenly, things stop working.
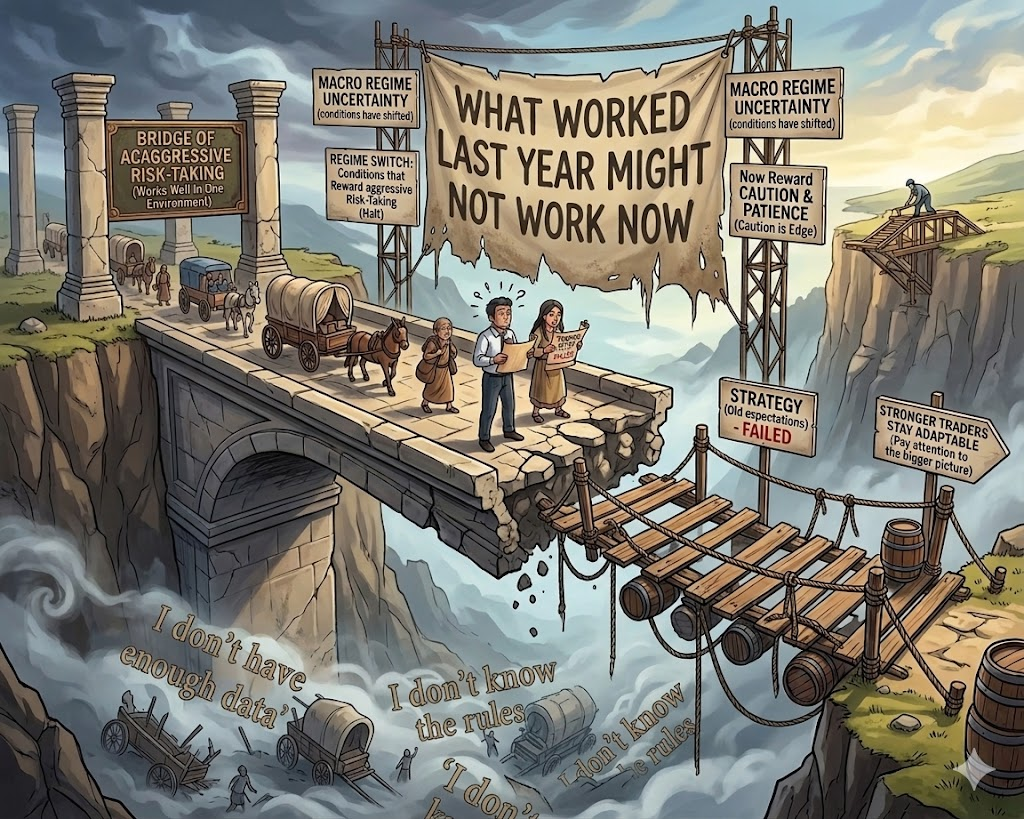
Interest rates change. Inflation shifts. Central banks react differently. Market leadership rotates. Strategies that performed well in one environment begin struggling in another.
That’s macro regime uncertainty.
The market moves in phases. Conditions that reward aggressive risk-taking can later reward caution and patience instead. Traders who ignore these shifts often keep applying old expectations to a new environment.
Strong traders stay adaptable. They pay attention to the bigger picture, not just individual charts. They understand that market behavior changes over time.
Because no edge works forever in every regime.
When you recognize changing conditions early, your decisions become more flexible. You stop forcing old strategies into new environments.
Adaptation keeps strategies alive.
Some traders like understanding how larger economic shifts influence market behavior and trading conditions.
If that’s you, you can explore a few market reads here:

Inverse Head and Shoulders
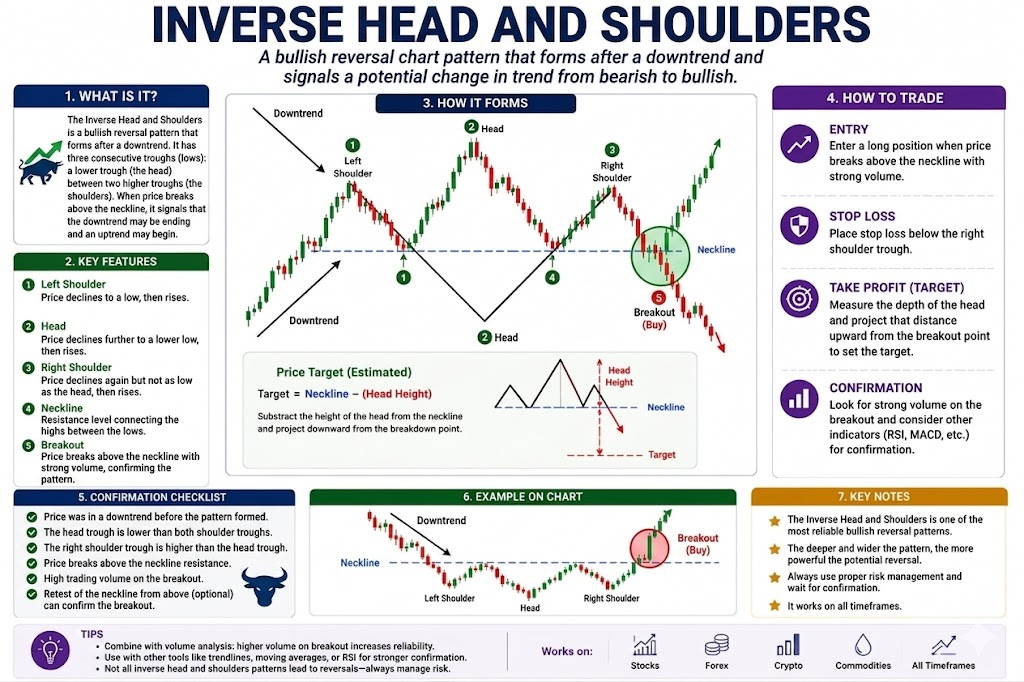
The Inverse Head and Shoulders is a classic chart pattern that is the exact mirror image of the standard Head and Shoulders. It signals that a long downtrend has finally run out of selling power, creating three distinct valleys where the middle valley is the deepest. It represents a total exhaustion of sellers.
🔴 The Red Zone (The Left Shoulder)
The Meaning: Price drops sharply, hits a low point, and then bounces back up. At this stage, it looks like a completely normal, healthy part of a downtrend. The Move: Wait. This is just the first valley of the pattern. You don't know it's a "shoulder" until the rest of the inverted shape forms.
🟡 The Yellow Zone (The Head)
The Meaning: Sellers push the price down again, blasting past the first low to create a new, deeper low (the Head). However, buyers step in aggressively and drag the price all the way back up to the same level as the first bounce. The Move: Watch closely. The high points between these valleys are connected to form a straight baseline called the Neckline. This is the ultimate line in the sand.
🟢 The Green Zone (The Right Shoulder & Break)
The Meaning: Sellers make one final, weak attempt to drop the price. The price falls but fails to reach the depth of the Head, bottoming out roughly level with the Left Shoulder. The price then rolls over and rallies straight up through the Neckline. The Move: Go! Blasting upward through the neckline is your confirmation signal to enter a long trade or exit shorts. The sellers have officially surrendered.
🔍 Two Simple Signals to Watch
1. The Sloping Neckline
The "Neckline" baseline doesn't have to be perfectly flat; it can tilt slightly upward or downward.
- The Logic: If the neckline tilts downward, it means the breakout might happen a bit earlier. If it tilts upward, breaking it shows immense strength because the buyers are already forcing higher highs before the official breakout.
2. The Volume Confirmation
Watch the trading volume across the three valleys and the final breakout.
- The Logic: In a true Inverse Head and Shoulders pattern, volume often decreases as the head and right shoulder form, showing that the sellers are losing interest. Crucially, the final break above the Neckline must happen with a large surge in volume to prove big buyers are backing the move.
💡 The Simple Secret
Think of this pattern as a failed attempt to sink the ship. The Left Shoulder is the first leak, the Head is the absolute lowest point of danger, and the Right Shoulder proves the sellers no longer have the strength to push the price back under.
To estimate how far the price will rally after the breakout, measure the distance from the bottom of the Head up to the Neckline—the price will often rally that exact same distance on its way up.

Waiting for the “Perfect” Entry

You spot the setup early 👀
Structure looks good.
Momentum is building.
Everything on your plan says this trade makes sense.
But instead of entering…
You start negotiating with price.
“I’ll wait for a slightly better entry.”
“Maybe it pulls back a little more.”
“Let me get it cheaper.”
So you wait.
And wait.
Meanwhile the market starts moving exactly the way you expected
Candle after candle.
Without you.
Now the emotional spiral begins.
At first you feel patient.
Then slightly annoyed.
Then desperate.
So eventually you do one of two things:
You chase the move late…or sit there pretending you’re “disciplined” while secretly dying inside watching the setup run without you 😂
This is the Cheap Entry Obsession.
And it tricks a LOT of traders because it sounds smart.
After all, getting a better entry IS good… sometimes.
But many traders take it too far.
They become so obsessed with precision that they completely forget the actual goal:
PARTICIPATING IN GOOD TRADES.
Not every move gives the perfect retracement.
Not every setup comes back to your dream entry.
Markets are not Amazon discounts waiting for your preferred price
Sometimes strength IS the information.
And the irony?
The traders obsessed with “saving a few points” often end up:
- Missing entire moves
- Taking worse late entries
- Destroying their psychology chasing afterward
All because they wanted perfection.
Professional traders understand something important:
A slightly imperfect entry inside a GREAT setup is often far more valuable than a perfect entry that never triggers.
Because trading is probabilities — not surgical precision.
And honestly, the need for the “perfect” entry is usually emotional.
It’s fear disguised as patience.
Fear of:
- Being wrong immediately
- Seeing drawdown
- Entering before a pullback
So the brain delays commitment by demanding a better price.
But the market doesn’t reward hesitation forever.
Eventually it moves.
With or without you.
So here’s something practical:
Instead of asking:
“How can I get the perfect entry?”
Ask:“Is this setup good enough to deserve participation?”
That shift changes everything.
Because over time, traders don’t lose the most money from bad entries.
They lose massive opportunity from never entering at all.