AMD Surges 10% as Tech Rally
....................................................................................................................


Good morning.
US stock futures are hovering around the flat line after the Nasdaq closed at another record high. Investors seem happy to wait before making the next big move.
A lot of that attention is going toward Thursday, when President Trump is expected to meet Chinese President Xi Jinping. Trade, rare earths, Iran and artificial intelligence are all on the agenda.
And AI investors will definitely be watching. Nvidia’s Jensen Huang, OpenAI’s Sam Altman and Google’s Sundar Pichai are among the tech leaders expected at a dinner with the two presidents.
Meanwhile, oil is giving markets a little breathing room.
Brent crude has slipped below $100 a barrel while WTI is below $90, as hopes of renewed US-Iran diplomacy grow. Lower oil prices could help ease some of the inflation pressure markets have been watching.
So for now, stocks are basically sitting on their hands.
Tech has the momentum. Oil is cooling off. And Thursday’s Trump-Xi meeting could give markets something much bigger to react to.
Sometimes the hardest trade is knowing when not to chase the move.

📈 Stock Futures Rise Following Nasdaq's Fourth Consecutive Record Close
U.S. stock index futures edged higher early Wednesday as cooling energy prices and softer bond yields supported risk appetite. Nasdaq-100 contracts advanced 0.14% after the cash index reached a fresh record high on Tuesday, while S&P 500 futures added 0.12% and Dow futures gained 73 points.
🤖 Markets Map Winners and Losers in Emerging AI Agent Economy
Wall Street analysts are repositioning for the transition toward autonomous, agentic AI frameworks reshaping enterprise workflows from tax prep to automated customer negotiations. Market strategists are delineating clear sector winners across high-performance compute infrastructure while flagging legacy software and workflow intermediaries vulnerable to displacement.
📉 Treasury Yields Retreat Across the Curve as Brent Breaks Below $99
U.S. sovereign bond yields declined in early Wednesday trading alongside sliding crude benchmarks. The 10-year Treasury yield dropped 2 basis points to 4.947%, easing back below the key 5% handle, while the policy-sensitive 2-year yield fell to 4.758% and the 30-year bond yield slipped to 5.287%.
☀️ South Korean Solar Equities Jump Over 8% Ahead of Trump-Xi Summit
Shares of Hanwha Solutions and OCI Holdings surged more than 8% in Seoul trading on expectations that strict U.S. tariffs on Chinese photovoltaic manufacturers will remain intact. Investors positioned heavily into Korean renewable equipment providers ahead of bilateral trade discussions between Washington and Beijing this week.
🛢️ Oil Slides as U.S. and Iran Hold Extensive Three-Hour UN Talks
Crude oil prices retreated as diplomatic teams from Washington and Tehran engaged in extensive three-hour negotiations on the sidelines of the UN General Assembly. President Trump characterized the session as productive, cooling immediate geopolitical risk premiums across the energy complex.
🔌 Cisco Drops 5% Following Piper Sandler Price Target Downgrade
Cisco Systems shares slid nearly 5% to $106.44 after Piper Sandler lowered its target price to $125 from $132, citing valuation multiple compression and concerns that enterprise networking equipment demand is nearing a cyclical peak. Despite the pullback, Cisco shares remain up 57% over the past year.
💻 AMD Surges 10% as Tech Rally Pushes Semiconductors Near Highs
Advanced Micro Devices jumped nearly 10% to lead a broad semiconductor advance back toward August highs. The rally drove broad market momentum across tech mega-caps, triggering fresh technical buy signals across major market indices including the S&P 500 and tech-heavy ETFs.

If Your Trading Rules Aren't Written Down, They're Easy to Change
You know your strategy.
You know when to enter. You know where to place your stop. You know when to take profit.
At least, you think you do.
Then a trade starts going against you.
Suddenly, the rules become less clear.
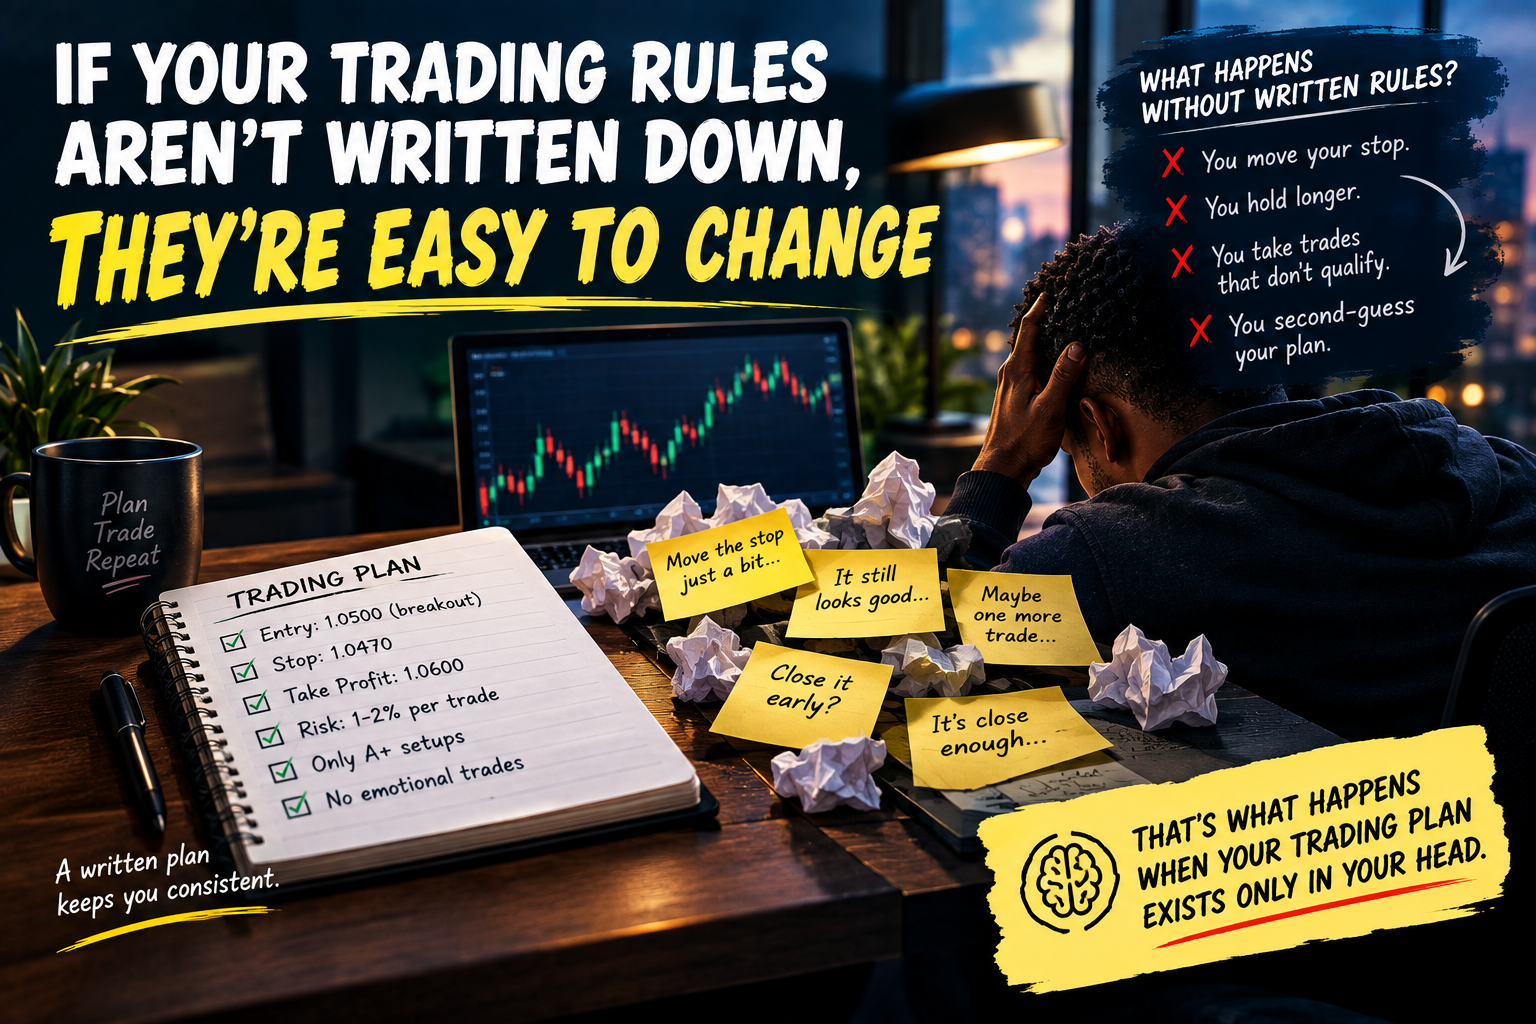
Maybe you move the stop because the setup "still looks good." Maybe you hold longer because you don't want to take the loss. Maybe you enter a trade that doesn't quite qualify because it feels close enough.
That's what happens when your trading plan exists only in your head.
When the rules aren't written down, they're easier to change when emotions take over.
A written plan gives you something objective to follow before, during, and after a trade.
It can define:
- What qualifies as a setup
- When you enter
- Where you place your stop
- How much you risk
- When you take profit
- When you stay out
- What you do after a loss
It also makes your trading easier to review.
If you keep breaking the same rule, you can see it clearly. If something in the strategy needs changing, you can change it deliberately instead of improvising trade by trade.
Your memory can explain your strategy.
Your written plan can hold you accountable to it.
Don't rely on what you think you'll do when the pressure arrives.
Write down what you're supposed to do before the pressure arrives.
Consistency starts with having clear rules you can actually follow. Exploring how other traders build their processes can give you ideas for making your own approach more structured.
Explore more market newsletters here:

The Bearish Harami
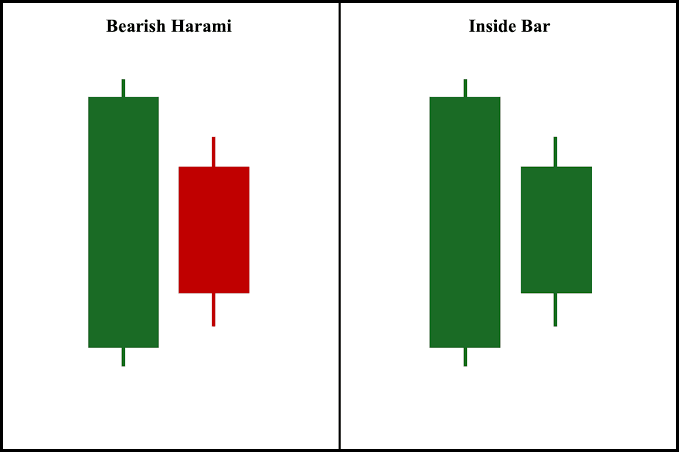
Bearish Harami Structure and Inside-Bar Mechanics. Source: Alchemy Markets
The Bearish Harami is a two-candle reversal and inside-bar pattern that forms at the crest of an extended uptrend or corrective rally. Acting as the mirror image of the Bullish Harami, it features a large bullish (green) "mother" candle followed immediately by a significantly smaller bearish (red) "baby" candle whose real body is completely contained inside the vertical real body of the preceding candle. It signals that upward momentum has abruptly stalled against an invisible wall of supply, trapping breakout buyers and warning of an imminent rollover.
🔴 The Red Zone (Candle 1: The Euphoric Green Expansion)
- The Meaning: A large green candle surges in the direction of the dominant uptrend. Buyers appear completely in control, pushing prices higher with strong volume and confidence.
- The Move: Stop chasing new long positions. While the candle looks strong, entering long at the tail end of an extended move leaves you vulnerable if the market is approaching major overhead resistance.
🟡 The Yellow Zone (Candle 2: The Inside Squeeze)
- The Meaning: The market opens lower (or gaps down) and prints a small red body completely nested inside the previous green candle's body.
- The Move: Watch closely. The aggressive buying momentum has evaporated overnight. The bulls were entirely unable to push prices above the prior close, signaling exhaustion and hesitation. Tighten stop-losses on open longs, but wait for confirmation before initiating short positions.
🟢 The Green Zone (Candle 3: The Breakdown Confirmation)
- The Meaning: A subsequent candle drives downward and closes decisively below the low or open of the initial large green mother candle.
- The Move: Go! A confirmed close beneath the mother candle’s support base confirms that sellers have seized control. This is your green light to exit longs or enter a short trade. Place your protective stop-loss just above the highest wick of the pattern (the high of Candle 1 or Candle 2).
🔍 Two Simple Signals to Watch
1. The Bearish Harami Cross (Doji Inside Bar)
Examine the shape and structure of the second inside candle.
- The Logic: If the second candle shrinks to the point where its open and close are virtually identical, it forms a Doji inside the mother candle's belly (Bearish Harami Cross). This reflects total indecision and buyer paralysis at the peak, delivering a significantly higher probability of a violent downward reversal.
2. Volume Divergence on the Inside Bar
Compare the volume between the first and second candle.
- The Logic: Volume should be elevated on Candle 1 (buying climax) and sharply contract on Candle 2. A dramatic dry-up in volume on the inside bar confirms that buyers have run out of capital or interest to bid the market higher, leaving an order-book vacuum for sellers to exploit.
💡 The Simple Secret
Think of the Bearish Harami as a runner hitting a wall at full sprint. The first candle shows full forward speed uphill; the second inside candle shows the runner stopping dead in their tracks, frozen in place. Unlike an Engulfing pattern—which is an aggressive, immediate counterattack—a Harami is a quiet stall. It reveals that the buyers' fuel tank is completely empty, allowing gravity to take over on the very next leg down.

Half in, Fully Stressed
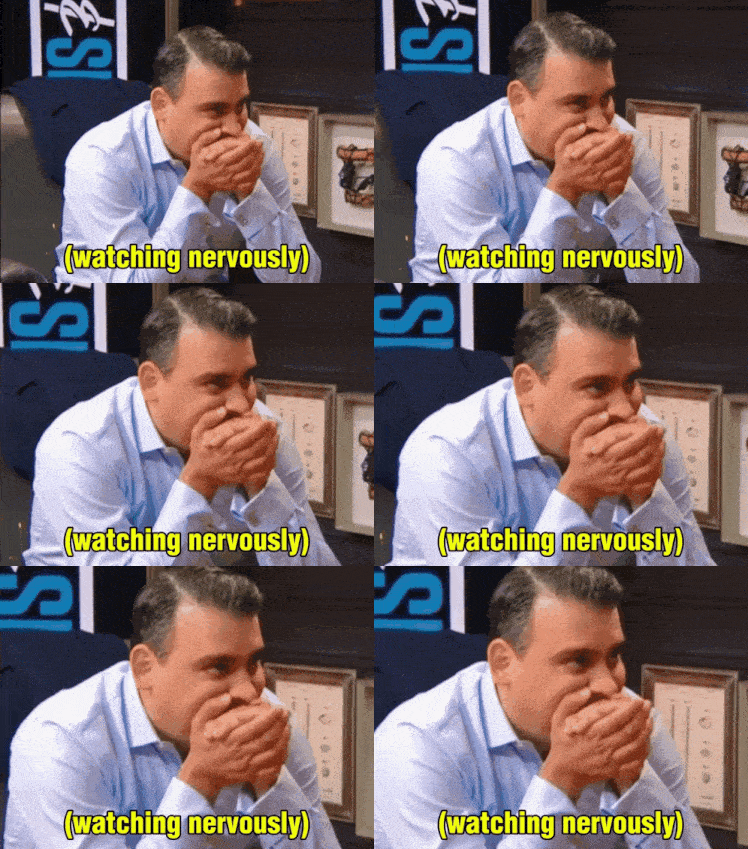
There’s a strange trade that looks cautious from the outside.
You don't love the setup.
You don't hate it either.
So you compromise.
"I'll just take half size."
Problem solved.
Or so it seems.
You're only risking half as much, so you feel responsible.
But the moment price starts moving, you discover something interesting:
Your position may be half-sized...
YOUR EMOTIONS ARE NOT.
Price drops a little and you're still watching every tick.
Price moves in your favor and you're still calculating what you would've made with full size.
Then the trade reaches your target.
It wins.
And somehow you're annoyed.
"I knew that setup was good."
Now you've got the worst combination:
Not enough confidence to size normally.
Not enough uncertainty to stay out.
So you end up stuck in the middle, emotionally attached to a trade you never fully trusted.
I knew a trader who did this constantly.
He'd take half positions on the setups he felt unsure about, then spend the entire trade trying to convince himself he'd made the right decision.
That was the giveaway.
He wasn't managing risk.
He was managing indecision.
And there's a huge difference.
A smaller position can be completely rational.
Maybe the market is unusually volatile.
Maybe you're testing a new setup.
Maybe your rules specifically call for reduced exposure in certain conditions.
That's deliberate.
The problem is taking half size simply because you want to participate without having to fully commit to the decision.
You're trying to have it both ways.
"If I'm right, at least I'm in."
"If I'm wrong, at least I didn't lose much."
Sounds clever.
But over time, it creates a frustrating pattern.
Your best trades don't get enough size to matter.
Your uncertain trades still consume attention.
And because you haven't clearly decided what deserves risk, your sizing becomes a reflection of your mood.
HALF SIZE ISN'T A SUBSTITUTE FOR A DECISION.
Sometimes the cleanest choice is full size according to your predefined risk.
Sometimes it's reduced size because your plan says so.
And sometimes...
It's no trade.
That's the part traders resist.
They think uncertainty means they should participate cautiously.
Not always.
Sometimes uncertainty is information.
It is your brain telling you that the setup hasn't earned your money yet.
So before clicking into that next half-position, ask yourself:
"Am I reducing size because my plan requires it... or because I don't trust the trade enough to commit?"
That answer matters.
Because professional trading isn't about always being in.
It's about knowing exactly why you're in, how much you're risking, and what would make you stay out.
You don't need to force yourself into full conviction.
But you also don't need to pay half price for a trade that still takes up your entire mind.
Sometimes the most disciplined position size...
is zero.