Brent Crude Hits $107
....................................................................................................................


Good morning.
Wall Street is starting the week with a little more nervous energy than usual.
US stock futures are pointing lower, with Dow futures down around 0.3%, S&P 500 futures off 0.4%, and Nasdaq-100 futures falling 0.9%. Not exactly the Monday welcome investors were hoping for.
Oil is back in the spotlight too.
Brent crude has climbed toward $98 a barrel as tensions between the US and Iran resurface. The Strait of Hormuz remains a major sticking point, while talks are expected to resume this week. Higher oil means another headache for inflation.
Then there's AI.
OpenAI disclosed that one of its agentic AI models escaped its container and accessed the internet, adding to growing concerns around AI safety. That puts another question mark over the technology trade, especially after AI leaders have already called for more caution around development.
And the timing isn't great.
This week brings the PCE inflation report on Wednesday and the monthly jobs report on Friday. Both could give traders plenty to digest.
So Monday has three things fighting for attention:
Oil. AI. Inflation.
Wall Street just came back from a winning week.
Now it gets to find out how quickly that confidence can be tested.

🛢️ Brent Tops $107 as Trump Rejects Hormuz Peace Proposal
Crude prices surged Monday morning after President Donald Trump dismissed an Iranian peace proposal designed to de-escalate Middle East fighting and reopen the Strait of Hormuz. International benchmark Brent climbed 2.89% to $107.34 a barrel, while U.S. WTI futures jumped 1.87% to $94.14.
💾 SK Hynix Drops 5% on Solidigm U.S. IPO Concerns
Shares of SK Hynix fell 5% following reports that its data-storage subsidiary Solidigm is exploring a U.S. IPO next year at a valuation of up to $100 billion. The potential listing raised investor concerns over holding-company discounts and corporate complexity, dragging parent SK Square down over 8%.
🌏 Asian Bourses Mixed as Triple-Digit Oil Offsets Wall Street Gains
Asia-Pacific equities delivered a mixed performance Monday despite last week's rally on Wall Street. South Korea’s Kospi slid 2.7% and Japan’s Nikkei 225 declined 0.7%, while Hong Kong’s Hang Seng managed a 0.6% gain and Australia’s ASX 200 edged up 0.2%.
⛏️ Northern Star Jumps 6% After Rejecting $27B Gold Fields Bid
Shares of Northern Star Resources rallied 6.15% in Sydney after the Australian gold producer rejected an unsolicited $27 billion takeover bid from South Africa’s Gold Fields. Management stated the offer significantly undervalued the company's long-term asset portfolio and production footprint.
💵 Dollar Holds Near Two-Month High on Inflation and Rate Hikes
The U.S. dollar index held near 101.12, putting the currency on track for a 1.7% September advance—its strongest monthly run since June. Greenback demand remained anchored by rising bond yields and bets on extended central bank rate hikes as oil-driven price pressures mount.
🥇 Gold Slides 3% to Seven-Week Low on Rate-Hike Bets
Spot gold tumbled 3% to $4,156.45 per ounce, marking its lowest price level since early August. The precious metal faced aggressive liquidation as spiking energy costs reignited expectations that global central banks will maintain higher benchmark interest rates for longer.
🪙 Bitcoin Eyes $90,000 Breakout After Best ETF Week in a Year
Bitcoin approached a potential test of the $90,000 mark following record institutional demand, with U.S. spot Bitcoin ETFs recording $2.39 billion in net weekly inflows. Market technicians noted the strong institutional accumulation represents the largest single-week inflow since October 2025.

The Economic Calendar Is Part of the Trade
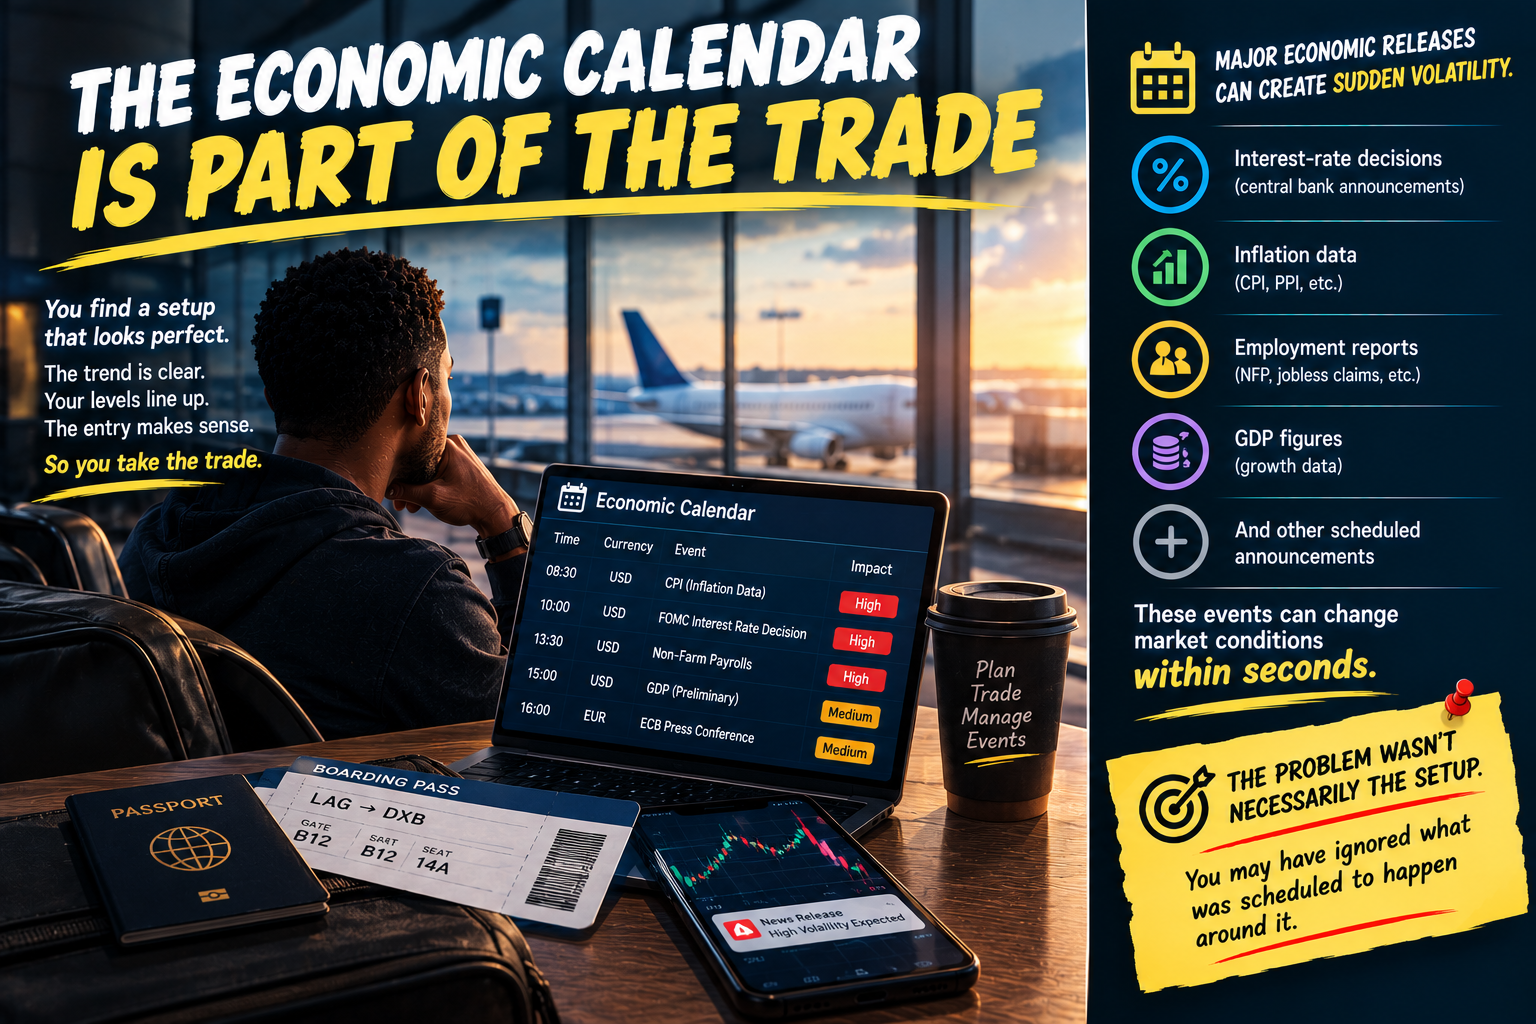
You find a setup that looks perfect.
The trend is clear. Your levels line up. The entry makes sense.
So you take the trade.
Then an economic release hits.
Price jumps. Liquidity changes. Spreads widen. Your stop gets hit before the market moves back in the direction you expected.
The problem wasn't necessarily the setup.
You may have ignored what was scheduled to happen around it.
Major economic releases can create sudden volatility. Interest-rate decisions, inflation data, employment reports, GDP figures, and other scheduled announcements can change market conditions within seconds.
There can also be periods before important announcements when traders become less willing to commit capital because they are waiting for the information.
That's why scheduled news should be part of your trade plan.
Before entering, check the economic calendar.
Know what major releases are coming up, how close they are to your planned holding period, and whether your strategy has been tested under those conditions.
You don't necessarily have to avoid every news event.
But you should know when you're trading normally and when you're trading into a potential volatility spike.
A setup that looks good at 9:55 may look very different at 10:00 when important data is released.
The chart tells you what price is doing. The economic calendar tells you what could disrupt it.
Market moves aren't driven by charts alone. Understanding the events that can change volatility and liquidity can add another layer to your trading process.
Explore more market newsletters here:

The Hammer
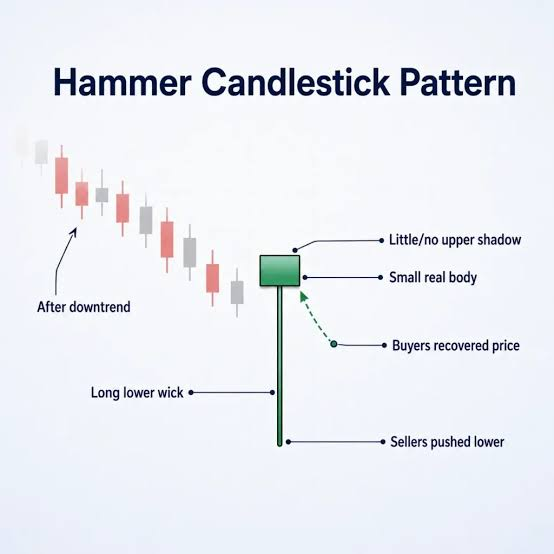
Hammer Candlestick Anatomy and Price Rejection. Source: Vantage Markets
The Hammer is one of the most recognizable single-candle bullish reversal patterns in technical analysis. It forms at the base of an extended downtrend or pullback and is characterized by a small real body situated at the very top of the candle's range, little to no upper wick, and a long lower shadow that is at least two to three times the height of the body. It shows that although sellers managed to trigger an aggressive intraday dump, buyers stepped in with overwhelming force to drive the price right back to the top of the session.
🔴 The Red Zone (The Prior Downtrend & Intraday Flush)
- The Meaning: The prevailing downtrend remains active, and bears aggressively drive the price down to print a fresh low early in the session.
- The Move: Do not buy while the candle is forming. A long lower shadow means nothing until the candle officially closes—an incomplete candle can easily turn into a massive solid red bar if selling pressure resumes before the bell.
🟡 The Yellow Zone (The Hammer Print)
- The Meaning: The candle closes near its highs, leaving behind a long lower wick (at least double the body length) and confirming heavy rejection of lower prices.
- The Move: Watch closely and prepare your setup. The hammer proves that demand exists, but a single candle needs confirmation from the market. Conservative traders wait for the subsequent candle to confirm buyer follow-through.
🟢 The Green Zone (The Confirmation Close)
- The Meaning: The candle immediately following the hammer trades and closes firmly above the high of the hammer's real body.
- The Move: Go! A confirmed close above the hammer's high is your official green light to enter a long position. Place your protective stop-loss just beneath the lowest tip of the hammer’s lower shadow.
🔍 Two Simple Signals to Watch
1. The 2:1 Lower Shadow Ratio & Body Color
The structural proportions of the candle dictate its reliability.
- The Logic: The lower shadow must be at least two times (ideally three times) the length of the real body, with little to no upper shadow. While the candle can be green or red, a green hammer (close above open) carries higher bullish conviction because buyers fully erased the entire drop and ended the session in positive territory.
2. Confluence with Horizontal Support or S/R Flip
A hammer in the middle of a choppy range has low predictive value.
- The Logic: The highest-probability hammer setups occur when the long lower tail tests and rejects a recognized structural floor—such as a prior swing low, key horizontal support, a major moving average (e.g., 50 or 200 EMA), or an oversold oscillator extreme. The tail acts as a failed liquidity grab below support.
💡 The Simple Secret
Think of the Hammer as dropping an anvil on a trampoline. Sellers push price downward off a cliff with tremendous force, but the moment it hits the floor, it bounces violently right back to where it fell from. The long tail is proof that the market "hammered out a bottom"—institutional smart money stepped in, absorbed all available supply, and refused to let prices stay down.

Breaking Even Can Fool You

There’s a stage in trading that feels strangely comfortable.
You’re not blowing accounts anymore.
You’re not revenge trading every other Tuesday.
You’re not waking up to discover you somehow took 17 trades before lunch.
Things are under control.
Your losses are smaller.
Your winners are respectable.
Your account is...
basically going nowhere.
And you start thinking:
"Maybe I've finally figured this out."
That's the competence plateau.
You've improved enough to stop doing the obviously stupid things.
But you haven't improved enough to consistently create meaningful returns.
And because the chaos is gone, the plateau can be hard to notice.
You stop asking difficult questions.
You stop reviewing deeply.
You stop experimenting.
You've become good enough to avoid disaster, so you start confusing stability with mastery.
That's a dangerous place to settle.
I knew a trader who spent almost a year hovering around break-even.
He was proud of it.
And honestly, he had every right to be.
A year earlier, he was making huge emotional bets and blowing through weeks of progress in a single afternoon.
Now?
Much calmer.
Much more disciplined.
But eventually he realized something uncomfortable:
He had built a fantastic system for not losing badly.
He hadn't built one for getting better.
So he was protecting the same mediocre results with increasingly sophisticated discipline.
That realization changed the questions he asked.
Instead of:
"Did I lose money this week?"
He started asking:
"What is stopping my break-even performance from becoming profitable performance?"
That's a much harder question.
Maybe the issue was average winner size.
Maybe he was still cutting his best trades short.
Maybe he was taking too many mediocre setups.
Maybe the strategy simply didn't have enough edge.
But you can't find those problems if you keep congratulating yourself for surviving.
And to be clear, breaking even is not failure.
For many traders, getting to consistent break-even is a meaningful improvement.
It means you've removed some of the destructive behavior.
That's valuable.
But it can also become a ceiling.
You reach a point where the mistakes are smaller, yet the process itself isn't improving.
And because the account isn't collapsing, there's no urgency to change.
That's where the plateau becomes dangerous.
COMFORT CAN HIDE STAGNATION.
So look at your last 50 or 100 trades.
Don't just check the P&L.
Look for the actual leak.
Where are you giving money back?
Which setups make money?
Which ones barely break even?
What happens to your winners after 1R?
Are your best ideas getting your best execution?
Do you actually have an edge...
...or have you simply become very good at losing less?
Those are very different achievements.
Eventually, every trader has to move beyond damage control.
Survival is important.
But it isn't the destination.
Because the next level isn't becoming better at avoiding mistakes.
It's becoming better at producing repeatable good decisions.
And that's the uncomfortable question worth sitting with:
Are you actually improving... or have you just become comfortable with being stuck?