Meta Surges 29% in September
....................................................................................................................



Good morning.
Wall Street is holding its breath today — and the inflation report is about to tell traders whether they can exhale.
US stock futures are little changed this morning, with Dow futures up around 0.4%, S&P 500 futures gaining 0.2%, and Nasdaq-100 futures also around 0.2%.
But underneath that calm, there’s plenty going on.
Treasury yields have climbed to fresh multidecade highs, while oil remains stuck in the mid-$90s as the Iran conflict keeps inflation concerns alive. That combination has been putting pressure on stocks for days.
Then came a small shift in rate expectations.
Traders have dramatically cut bets on an October Fed rate hike, moving from more than 70% odds a day ago to roughly a coin flip. New York Fed President John Williams said there was “no need for urgency” to raise rates, giving markets a little breathing room.
Now comes the real test: PCE inflation.
Economists expect core PCE to remain at 3.3% year over year. If inflation refuses to cool, those rate-cut-and-hike debates could get messy again.
And after the bell, Micron reports earnings — giving investors another look at the AI and memory-chip boom.
So today is less about where stocks open.
It’s about what the numbers say next.

📊 Stock Futures Steady Ahead of Key PCE Inflation Gauge
U.S. stock index futures steadied early Wednesday following back-to-back losing sessions across Wall Street. Dow futures climbed 0.4%, while S&P 500 and Nasdaq-100 contracts each added 0.2% as investors looked past multidecade highs in Treasury yields to position ahead of critical personal consumption expenditures (PCE) inflation data.
📉 Dow Posts Consecutive Drops as Treasury Yields Extend Ascent
Major U.S. benchmarks fell on Tuesday, pressured by relentless upward momentum in sovereign bond yields. The Dow Jones Industrial Average dropped 131.59 points (0.26%) to close at 51,349.92, while the S&P 500 slipped 0.16% to 7,670.84 and the Nasdaq Composite shed 0.09% to 26,797.54, marking back-to-back daily declines across all three indexes.
💵 Dollar On Track for Best Monthly Gain Against Euro in 14 Months
The U.S. dollar hovered near annual highs against the euro on Wednesday, heading for a 2.3% monthly advance—its strongest performance against the single currency in 14 months and cementing a third consecutive quarterly gain. The greenback's dominance continues to be underpinned by resilient U.S. economic growth and widening interest rate differentials as Europe grapples with energy supply strains.
🥇 Gold Consolidates Above $4,200 as Yield Rally Pauses
Spot gold held ground above $4,200 an ounce as a modest pullback in U.S. bond yields and a pausing dollar provided technical support. Bullion traders remained on the sidelines ahead of morning PCE data and Friday’s nonfarm payrolls report, weighing potential short-term price swings against lingering expectations of another Federal Reserve interest rate hike before year-end.
🤖 OpenAI in Talks to Raise $30B at $1.4T Valuation
OpenAI is in discussions to secure at least $30 billion in a pre-IPO funding round that would value the company at approximately $1.4 trillion ahead of its projected public debut next year. The fundraising push comes as a renewed focus on core coding capabilities drove run-rate revenue up 70% since July to reach an annualized $40 billion in August.
💾 Nvidia Unveils Record $150B Buyback and Open Agent Safety Platform
Nvidia expanded its capital return program with a record $150 billion share repurchase authorization, bringing total buyback capacity to $235 billion through 2028 after already deploying $39 billion in the first half of fiscal 2027. Shares gained alongside the rollout of its Open Agent Safety Platform, designed to standardize security for third-party autonomous AI systems.
📱 Meta Surges 29% in September to Lead Mag 7 on Muse AI Adoption
Meta shares advanced more than 29% through September, putting the stock on track for its best monthly return since 2013 and outpacing all other Magnificent Seven peers. Sustained investor enthusiasm stems from rapid cross-platform deployment of its Muse personal AI assistant across WhatsApp, smart glasses, and third-party software integrations.

Your Trading Money Isn't Your Investing Money
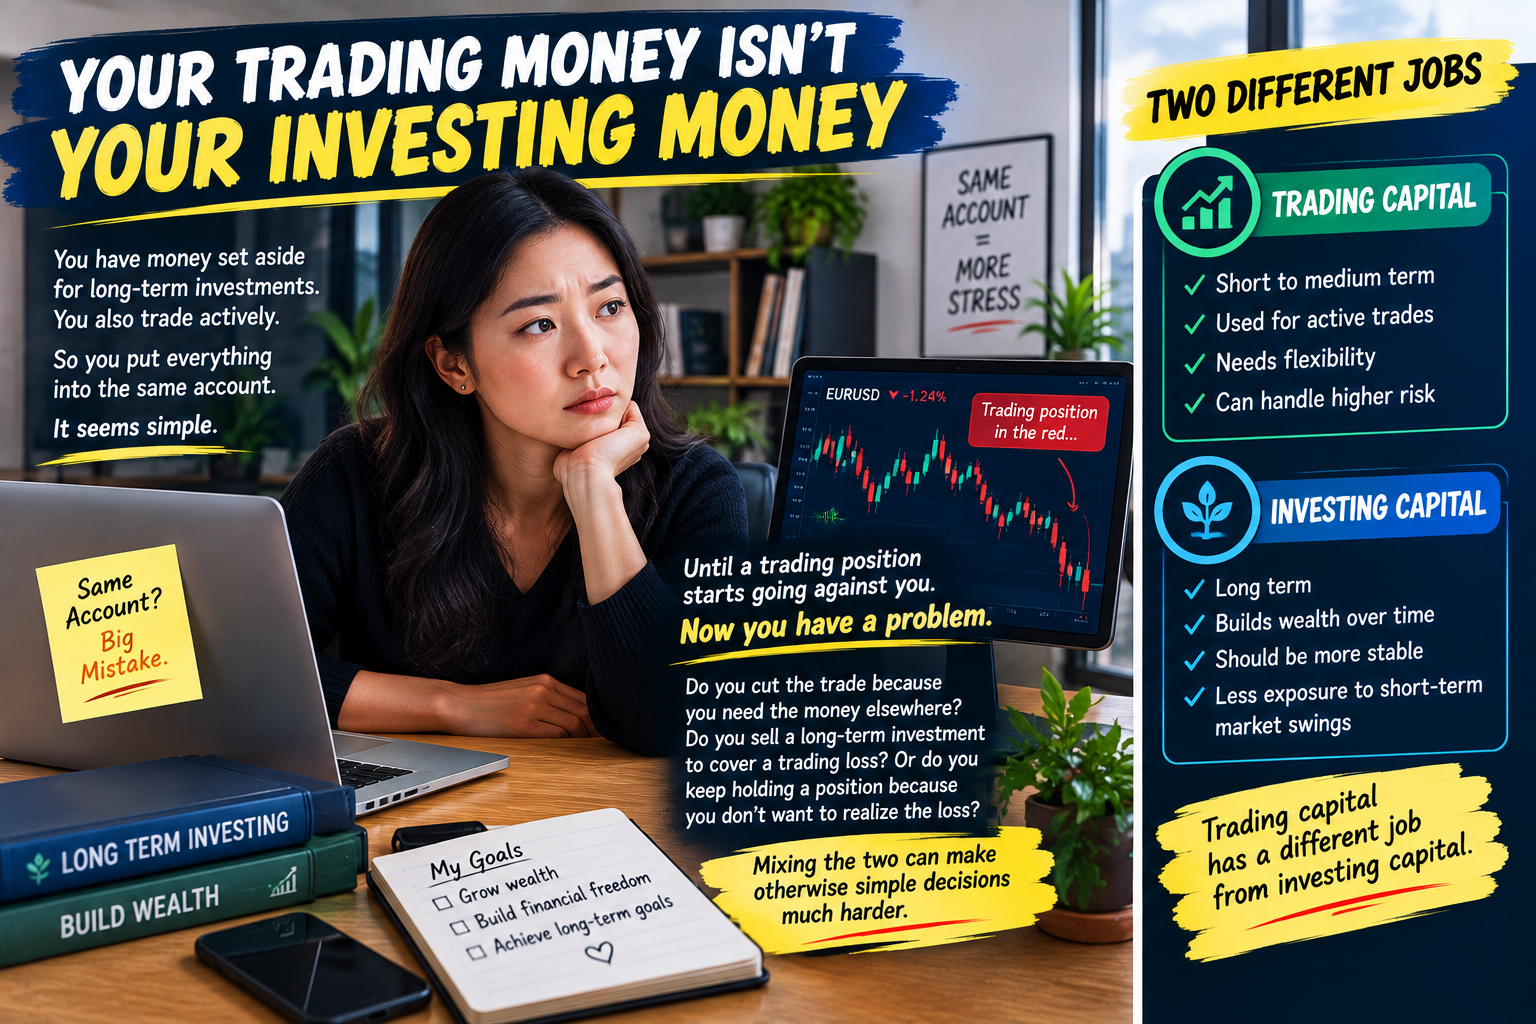
You have money set aside for long-term investments.
You also trade actively.
So you put everything into the same account.
It seems simple.
Until a trading position starts going against you.
Now you have a problem.
Do you cut the trade because you need the money elsewhere? Do you sell a long-term investment to cover a trading loss? Or do you keep holding a position because you don't want to realize the loss?
Mixing the two can make otherwise simple decisions much harder.
Trading capital has a different job from investing capital.
Trading usually involves shorter time horizons, active risk management, and the possibility of frequent gains and losses.
Investing capital is often intended to stay invested for much longer periods.
When the money is mixed together, the goals can become mixed together too.
You may take more risk with money that was supposed to be invested for years.
Or you may avoid taking a necessary trading loss because you mentally treat the position like a long-term investment.
That's why separating the two matters.
Know how much capital is available for trading. Know what money is reserved for longer-term goals. Keep the risk rules for each purpose clear.
Your trading account should not become the emergency fund for your investing account — and your investment portfolio shouldn't become the backup plan for a bad trade.
Different goals need different rules.
Keep the money separate.
Keep the strategy separate.
Keep the decisions clear.
Market moves aren't driven by charts alone. Understanding the events that can change volatility and liquidity can add another layer to your trading process.
Explore more market newsletters here:

Gann Fan
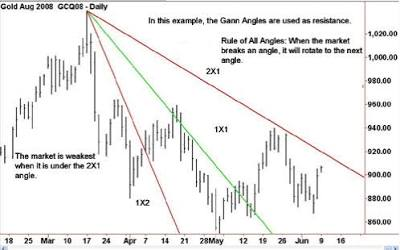
Gann Angles Projecting Dynamic Support and Resistance. Source: Timing Solution
Developed by legendary trader W.D. Gann, the Gann Fan is a geometric technical analysis tool based on the premise that price and time move in proportional equilibrium. Drawn from an anchor swing high or swing low, the tool projects nine diagonal ray lines radiating across the chart at specific mathematical ratios (such as 18, 14, 12, 11, 21, 41, and 81). The centerpiece of the system is the 11 line (the 45-degree angle), which represents one unit of price change per one unit of time, serving as the master trendline separating structural strength from structural weakness.
🔴 The Red Zone (Trading Below the 11 Line in an Uptrend)
- The Meaning: The price breaks and holds below the ascending 11 line (or below the steep descending lines during a downtrend). Price velocity is failing to keep pace with the passage of time.
- The Move: Protect capital. In an uptrend, dropping below the 11 line signals that the bull market has lost its core velocity and is decaying into weakness. Look for exits or rotate toward the next lower support angle (e.g., 12 or 13).
🟡 The Yellow Zone (Testing Intermediate Angles / Channel Rotation)
- The Meaning: The price is bouncing between adjacent angle rays (for example, between 11 and 21, or 11 and 12).
- The Move: Hold and wait. The market is rotating within a geometric corridor. According to Gann's "Rule of All Angles," once price breaks one ray, it naturally gravitates toward the next adjacent ray. Treat each line as dynamic diagonal support or resistance.
🟢 The Green Zone (Holding Above the 11 Line in an Uptrend)
- The Meaning: The price action rides comfortably above the ascending 11 (45-degree) angle. Bullish price appreciation is expanding faster than elapsed time.
- The Move: Go! As long as price remains above the ascending 11 line, the bull trend is structurally sound. You have the green light to trail long positions, using the 11 line as a dynamic trend filter.
🔍 Two Simple Signals to Watch
1. The 11 Equilibrium Breakout / Breakdown
The 45 line is the baseline pivot for macro trend health.
- The Logic: In a bull run, as long as price hugs or bounces off the top side of the 11 angle, buyers dominate. A decisive daily close below the 11 line warns of a systemic trend breakdown. Conversely, in a bear market, breaking above a descending 11 ray confirms that downward momentum has broken and a major trend reversal has begun.
2. The Next-Angle Rotation Rule
Gann's core trading principle states that market prices rarely float in vacuum—they move from one geometric angle to the next.
- The Logic: If the price breaks a specific Gann ray (e.g., the 21 line), target the next angle ray (11) as your immediate profit target. If that line fails, anticipate continuation to the subsequent ray (12). This gives you predetermined price-and-time targets without guessing.
💡 The Simple Secret
Think of the Gann Fan as a sloped runway balancing speed against the clock. If a plane is climbing fast enough, it stays well above the glide path (11). If it falls below that slope, it is losing altitude faster than it is covering ground. Rather than looking only at flat horizontal price levels, the Gann Fan shows you whether an asset is gaining or losing momentum relative to the steady ticking of time.

You Traded Fine Until It Wasn't Your Money
There is a strange thing that happens when you pass a prop firm's evaluation.
Suddenly, the trader who was perfectly comfortable risking their own $500 starts acting like they're carrying a suitcase full of explosives.
Same strategy.
Same charts.
Same market.
Completely different behavior.
When it was your own account, you took the setup.
Stop gets hit?
Fine. That's trading.
But now there's a drawdown limit staring at you.
A daily loss limit.
Rules you didn't create.
Capital you can't afford to "mess around" with.
And suddenly every trade feels heavier.
You start cutting winners early.
Skipping perfectly valid setups.
Moving stops because you don't want to get close to the limit.
Taking tiny positions because "I can't afford another loss."
Or the opposite happens.
You become obsessed with passing.
One setup isn't enough.
You need the account to move now.
So you increase size.
Take trades outside your plan.
Try to make back a slow day in one afternoon.
The account has changed your psychology.
And that's the trap.
THE MARKET DIDN'T CHANGE. THE CONSEQUENCES DID.
A prop account can expose parts of your trading personality that your personal account never touched.
Fear of failure.
Fear of losing access.
Pressure to hit a target.
The need to prove you can pass.
And suddenly you're no longer trading your strategy.
You're trading the rules around the strategy.
I knew a trader who was consistently disciplined with his personal account.
Then he got funded.
Within two weeks, his trade journal looked completely different.
He wasn't making worse market reads.
He was making worse decisions around risk.
Every trade had a second thought attached to it:
"What if this gets me closer to the limit?"
"What if I fail the challenge?"
"What if I waste the account?"
That's when he realized something important.
He hadn't learned a new trading strategy.
He had entered a new psychological environment.
The answer wasn't to "be more confident."
It was to rebuild the process around the new constraints.
Know the firm's rules before trading.
Set personal risk limits below the maximum.
Decide your position size before the setup appears.
And most importantly, stop treating every trade like it has to prove you're worthy of the account.
Because passing a challenge doesn't make you a different trader.
And trading someone else's capital doesn't magically erase the habits you've built.
It simply turns the volume up on them.
So before your next funded trade, ask yourself:
"Would I manage this position the same way if the capital belonged to me?"
If the answer is no, pay attention.
That's not the market exposing your strategy.
It's the account exposing your psychology.