Meta Nears $2T Valuation
....................................................................................................................



Good morning.
Wall Street is trying to look calm, but the bond market isn't exactly cooperating.
US stock futures are barely moving this morning, with Nasdaq-100 futures up around 0.2% as investors keep watching the two things that have been moving markets all week: oil and bond yields.
The big number is the 10-year Treasury yield, which climbed to 5.16% on Thursday — its highest level since the global financial crisis. That makes stocks, especially higher-growth tech names, harder to price.
Oil isn't helping much either. WTI has slipped toward $92 a barrel, while Brent is still around $105. US gas prices are also approaching $4.50 a gallon, which keeps pressure on consumers and inflation expectations.
Now investors get another piece of the puzzle: the University of Michigan's consumer sentiment report. The key question is whether Americans are becoming more worried about inflation.
Meanwhile, Xi Jinping's US visit wraps up today. Thursday's dinner had plenty of spectacle and plenty of CEOs, but relatively few major policy announcements. For now, the US and China appear to be keeping their trade relationship largely unchanged for several months.
So Friday starts quietly.
But with yields this high, quiet doesn't necessarily mean comfortable.

🛢️ Oil Slides as U.S.-Iran Truce Hopes Outweigh Saudi Attacks
Crude prices fell Friday as optimism surrounding potential diplomatic progress between Washington and Tehran overshadowed concerns over Houthi strikes on Saudi energy infrastructure. Brent crude eased 0.4% to $106.20 a barrel, while WTI dropped 1.1% to $93.59.
🥇 Gold Falls Toward $4,270 as Fed Rate-Hike Fears Persist
Spot gold was on track to end the week lower around $4,270 an ounce, down over 2% since last Friday. Persistent energy-driven inflation continues to bolster expectations for further Federal Reserve rate hikes, even as negotiators explore a phased deal to reopen the Strait of Hormuz.
📱 Meta Nears $2T Valuation on Strongest Month Since 2013
Meta Platforms shares have jumped 36% in September, putting the tech giant on the verge of crossing the $2 trillion market capitalization mark. The massive rally has been propelled by the breakout success of its newly launched Muse personal AI assistant, which has eased investor concerns over heavy capital spending.
💵 Buffett Warns Dollar Is 'Going to Hell' at Final Meeting
Stepping down as Berkshire Hathaway chairman at age 96, Warren Buffett delivered a stark parting warning regarding long-term currency debasement and excessive sovereign debt. The legendary investor urged individuals to shockproof their savings against the deteriorating purchasing power of the U.S. dollar.
🛡️ Bitget Suspects North Korea Behind $352M Crypto Breach
Crypto exchange Bitget revealed that a major security breach compromised approximately $351.6 million in digital assets, with preliminary forensics pointing to North Korean state-backed cyber groups. CEO Gracy Chen confirmed that investigators traced attack vectors and VPN addresses previously tied to state-sponsored hacking campaigns.
🇯🇵 Oracle Japan Jumps 7% on Record Q1 Cloud Performance
Shares of Oracle Corp. Japan surged over 7% in Tokyo after posting record quarterly revenue and profit driven by rapid enterprise cloud adoption. The rally diverged sharply from a 3% decline in U.S. parent shares following force majeure notices related to its New Mexico data center development.
🪙 Bitcoin ETF Inflows Moderate to $191M as Total Tops $2.8B
U.S. spot Bitcoin exchange-traded funds added $191 million on Thursday, bringing their six-day cumulative haul to $2.8 billion. Although the daily inflow pace slowed for a third consecutive session, the steady demand lifted year-to-date net ETF flows to $787 million.

A High Win Rate Doesn't Guarantee Profit

You test a strategy and discover it wins 70% of the time.
That sounds great.
Seven winners out of every ten trades feels like a system you'd want to trade.
But then you look at the account balance.
It's losing money.
How?
Because win rate is only one part of the equation.
Imagine winning $50 on each of those seven trades but losing $200 on each of the three losing trades.
Your 70% win rate still leaves you down $250.
This is why traders can get too focused on being right.
They try to increase their win rate while ignoring how much they make when they're right and how much they lose when they're wrong.
A profitable system doesn't need to win most of the time.
What matters is how the wins and losses work together.
Your average win, average loss, position size, trading costs, and frequency of trades all affect the final result.
That's why two strategies with the exact same win rate can produce completely different results.
Instead of asking only:
"How often does this strategy win?"
Ask:
"What happens to my account when it wins and when it loses?"
A high win rate can look impressive.
But profitability is what matters.
Being right often isn't the same as making money.
Trading performance is about more than one statistic. Looking at different market perspectives can help you understand the numbers behind a strategy instead of judging it by win rate alone.
Explore more market newsletters here:

TRIX (Triple Exponential Average)
Developed by Jack Hutson in the early 1980s, the TRIX indicator is a momentum oscillator that displays the 1-period percentage rate of change of a triple-smoothed Exponential Moving Average (EMA). By passing price data through three successive exponential smoothings before calculating momentum, TRIX completely filters out minor price noise, cyclical jitter, and short-term whipsaws. It oscillates above and below a central Zero Line to provide exceptionally clean trend direction, overbought/oversold boundaries, and divergence signals.
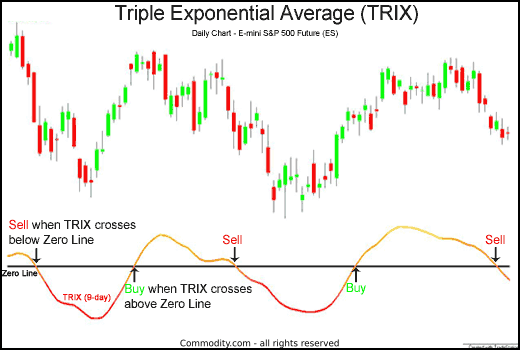
TRIX Zero-Line Crossover Signals and Trend Confirmation. Source: Commodity.com
🔴 The Red Zone (Crossing Below Zero / Negative Slope)
- The Meaning: The TRIX line crosses below the Zero Line or turns downward from an extreme positive peak. Triple-smoothed downward momentum is accelerating, confirming that sellers are firmly in control of the medium-term trend.
- The Move: Protect capital. Exit long positions or open short trades. Because of the heavy three-layer smoothing, a cross below zero is not a knee-jerk reaction—it confirms a durable, systemic downtrend.
🟡 The Yellow Zone (Hovering Along the Zero Line)
- The Meaning: The TRIX line flattens out and hugs the 0.00 baseline. The triple-smoothed rate of change is zero, meaning price is drifting sideways without directional acceleration.
- The Move: Hold and wait. The market is in an equilibrium phase. Avoid opening trend-following breakout trades while TRIX is flat, as low-momentum environments lack the follow-through needed to sustain moves.
🟢 The Green Zone (Crossing Above Zero / Positive Slope)
- The Meaning: The TRIX line crosses above the Zero Line into positive territory. Triple-smoothed buying velocity has outpaced historical rates of change, confirming a powerful bull trend.
- The Move: Go! A confirmed cross above zero is your primary green light to enter long positions and ride the prevailing trend with minimal risk of false whipsaws.
🔍 Two Simple Signals to Watch
1. The Signal Line Crossover (Early Entry Trigger)
Many charting platforms overlay a 9-period EMA "Signal Line" on top of the TRIX line.
- The Logic: Waiting for TRIX to cross the Zero Line offers high safety, but it can lag the initial bottom. Aggressive traders use the Signal Line cross: when TRIX crosses above its signal line while deep in negative territory, it provides an early buy trigger well before the zero line is reached.
2. High-Conviction Divergence
Because TRIX removes insignificant noise, its divergences carry significantly more weight than those of standard RSI or MACD.
- The Logic: If the price chart makes a higher high but TRIX forms a lower high (Bearish Divergence), the underlying rate of price acceleration is collapsing, signaling an imminent macro top. When price prints a lower low but TRIX carves out a higher low (Bullish Divergence), an institutional reversal is quietly taking shape.
💡 The Simple Secret
Think of TRIX as a triple-filtered shock absorber for momentum. Standard momentum indicators react to every single bump in the road, causing frequent false alarms. TRIX runs the price through three separate smoothing passes before checking the speedometer—if the line turns and crosses zero, the move isn't market noise; it is a genuine, sustained shift in institutional momentum.

September Isn't Your Trading Strategy
Every September you're bearish.
Every Q4, you're bullish.
January?
"New year, new rally."
At some point, you stop looking at the chart and start looking at the calendar.
"Markets usually do well this time of year."
"September is always ugly."
"Q4 is when the big move happens."

And suddenly you've got a trade before you've even got a setup.
That's the Seasonal Pattern Superstition.
Seasonality can be useful.
Historical tendencies can give you context.
But there's a massive difference between saying:
"This period has behaved this way historically."
and:
"This period WILL behave this way again."
That second belief is where traders get into trouble.
Imagine it's September.
You've heard the same story everywhere: September is weak.
So you start looking for shorts.
The market pushes higher.
"Probably temporary."
It pushes higher again.
"Just a squeeze."
Then it breaks your resistance level.
"This can't last."
At that point, you're no longer trading what price is doing.
You're defending what the calendar told you was supposed to happen.
And that's dangerous because markets don't know what month it is.
They don't look at the calendar and say:
"Ah yes, September. Time to sell."
They respond to actual conditions.
Positioning.
Liquidity.
News.
Flows.
Expectations.
And those things change.
This works the other way too.
You've heard that Q4 is historically strong, so every dip starts looking like a buying opportunity.
But a seasonal tendency doesn't tell you when to enter, where you're wrong, or how much risk to take.
It just gives you a backdrop.
That's all.
A trader I knew once joked that he had become "long October" before October even started.
Funny.
But also revealing.
He had a historical pattern in his head and was trying to make the market fit it.
The better approach is simple:
Use seasonality to form a question, not a conclusion.
Instead of:
"Q4 usually rallies, so I'm buying."
Try:
"Q4 has historically been stronger. Does the current price action actually support a bullish trade?"
Now you're using history as context instead of treating it like prophecy.
Because the calendar can tell you what has happened before.
It cannot tell you what this chart is about to do.
So keep the seasonal data.
Just don't let it become the person placing your trades.
Your edge lives in the conditions you can actually see, measure, and execute.
Not in what the calendar promised last year.