Tech Stocks Rally on Nvidia
....................................................................................................................


Good Morning,
May wrapped up at record highs, and the bulls are trying to push June even higher.
We’re kicking off the new month with green screens. After a monster May that saw the Nasdaq surge over 8% and the S&P 500 jump about 5%, futures are keeping the momentum alive. Nasdaq futures are leading the charge up 0.6%, while the S&P 500 is tracking 0.3% higher. Tech is still firmly in the driver's seat, but all eyes are glued to Washington this morning.
Trump is huddling in the Situation Room. Over the weekend, the President announced he’s gathering his national security advisers to make a "final determination" on a draft deal with Iran. Trump is demanding the immediate, toll-free reopening of the Strait of Hormuz and a total ban on Iran ever getting nuclear arms. Energy markets are twitching on the news—Brent crude ticked up to $92 a barrel this morning, even though oil actually just suffered its biggest monthly drop since 2020 on hopes that a 60-day ceasefire might actually get signed.
We're staring down a massive "Jobs Friday." While geopolitics dominates the morning chatter, the real data test comes at the end of the week. Friday’s nonfarm payrolls report is the main event. It will show exactly how strong the labor market is and, more importantly, give us a clear hint on whether the Fed will start cutting rates or keep them locked down.
It’s an optimistic but cautious start to June. The record highs are a nicev cushion, but the market is hungry for a signed peace deal and a clean path forward.

🚢 U.S. and Iran Trade Deal Drafts as Israel Expands Lebanon Assault
Washington and Tehran have actively exchanged drafts for a formal trade and peace agreement to resolve their three-month-old war. However, the diplomatic progress faces an immediate hurdle as Israel simultaneously expands its military operations against Hezbollah in Lebanon, threatening to destabilize the fragile Gulf negotiations.
📈 Samsung and LG Rally on Expected AI and Robotics Tie-ups with Nvidia
Shares of South Korean tech heavyweights surged on Monday—with Samsung Electronics jumping 9.5% and LG Electronics skyrocketing 28%. The buying frenzy is driven by anticipation surrounding Nvidia CEO Jensen Huang's upcoming visit to Seoul to meet with local executives, fueling intense speculation over major partnerships in AI and robotics.
📊 South Korea Export Growth Hits 40-Year High on Insatiable AI Chip Demand
South Korea’s total exports grew a staggering 53.2% year-over-year in May to reach a record $87.75 billion, marking the fastest annual expansion rate since January 1984. The unprecedented boom was spearheaded by semiconductor exports, which hyper-scaled 169.4% as global tech giants aggressively expand AI data center footprints.
🛢️ Asia Stocks Extend AI Boom as Oil Edges Higher on Gulf Risk
Asian markets firmed on Monday as relentless AI enthusiasm handily offset a lack of definitive progress in the U.S.-Iran peace talks. Because a definitive deal to reopen the Strait of Hormuz remains unsigned, international benchmark Brent crude ticked up 2.1% to $93.02 a barrel as energy markets price in ongoing maritime bottlenecks.
💵 Dollar Steadies Near 160 Yen as Markets Await Fed Policy Signals
The U.S. dollar held firm on Monday, trading just shy of the critical 160-yen threshold as currency traders brace for potential Japanese market intervention. The greenback is finding support as sticky energy costs prompt fixed-income markets to price in a 50-50 chance of a Federal Reserve interest rate hike by the end of 2026.
🌏 Asia-Pacific Markets Trend Higher Following Blockbuster Export Data
Regional stock indexes pushed further into positive territory on Monday, supported by Wall Street's record-setting close and monster electronics export figures out of Seoul. South Korea’s Kospi advanced 4.4% and Japan’s Nikkei added 1.1%, shrugging off flat manufacturing data out of mainland China where domestic factory activity stalled.
🖥️ SoftBank to Build Advanced AI Data Centers in France with Major Investment
SoftBank Group has announced a massive sovereign infrastructure investment to construct a network of next-generation AI data centers across France. The multi-billion-dollar European expansion aims to deploy sovereign cloud capabilities optimized for agentic AI architectures, utilizing SoftBank's vast computing hardware pipeline.

The Market Isn’t Always Moving for the Reasons You Think
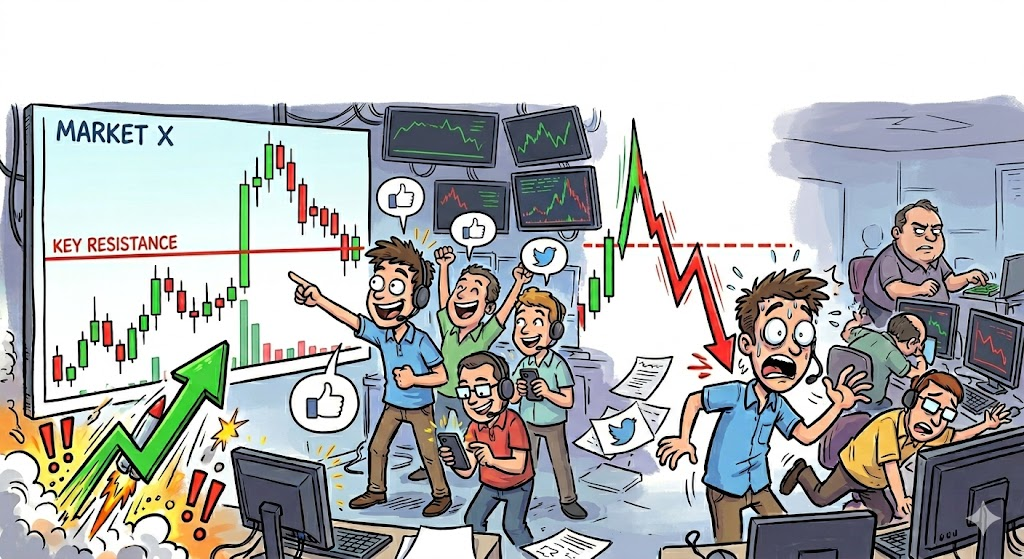
A chart suddenly explodes higher.
Volume appears out of nowhere. Price breaks a key level. Social media lights up. It looks like the start of a big move.
Then it reverses.
Fast.
This happens often in thin markets where there aren’t many buyers and sellers. It doesn’t take much money to create large price swings. A few large orders can push price around and create the illusion of momentum.
That’s where traders get trapped.
They mistake movement for opportunity. They chase the breakout, only to discover there was never much behind it.
Strong traders pay attention to liquidity. They understand that not every move is meaningful. Before they commit capital, they ask whether there is enough participation to support the move.
Because price movement alone is not evidence.
When you learn to recognize thin markets, you become more selective. You stop reacting to every spike and start focusing on moves with real conviction behind them.
Not every move deserves your money.
Some traders like exploring how market structure influences price action and where hidden risks tend to appear.
If that’s you, you can explore a few market reads here:https://refind.com/n/c/s?put=7soK

Bollinger Bands
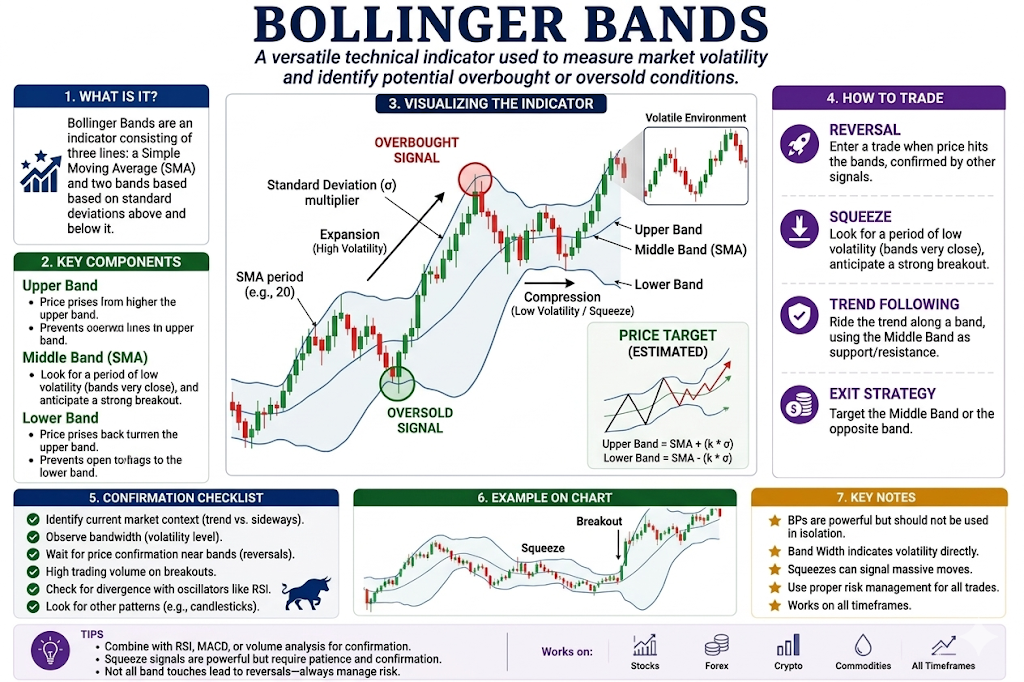
Bollinger Bands act like a flexible, elastic boundary around the price of an asset. They use three lines—a middle moving average and two outer bands—that expand and shrink automatically based on how wild or quiet the market is. It is designed to show you if a price is relatively "expensive" or "cheap."
🔴 The Red Zone (The Upper Band Touch)
The Meaning: The price rallies all the way up and touches or breaks through the Upper Band. This shows that the price has moved to an extreme high relative to its recent average. The Move: Caution. The asset is entering an "expensive" territory. While the trend can continue, this is a high-alert zone where the price is stretched and likely to snap back downward.
🟡 The Yellow Zone (The Middle Line)
The Meaning: The price is floating right around the Middle Line (which is a standard 20-period moving average). The Move: Hold. This is the baseline or "fair value" of the asset. In a healthy trend, the market will often pull back to this middle line, catch its breath, and use it as a trampoline to bounce back out to the edges.
🟢 The Green Zone (The Lower Band Touch)
The Meaning: The price drops heavily and touches or breaks through the Lower Band. This indicates that the price has plummeted to an extreme low relative to recent data. The Move: Get ready. The asset is now in a "cheap" or discounted territory. Panic selling has stretched the rubber band to its limit, meaning a relief bounce or a sharp turn back toward the middle is often right around the corner.
🔍 Two Simple Signals to Watch
1. The Volatility Squeeze
Sometimes the upper and lower bands tighten up so much that they form a very narrow, skinny tunnel around the price.
- The Logic: This is called a "Squeeze." It means the market has gone completely quiet. Because volatility always moves in cycles, a tight squeeze is a massive warning that a giant, explosive breakout is coming. Whichever way the price breaks out of that tight tunnel is usually the direction of the next major trend.
2. The Band Walk
In a fiercely powerful trend, the price will hit an outer band and actually continue to ride along the edge of it for several candles in a row.
- The Logic: If the price is "walking the upper band," do not try to sell it. It means the upward momentum is incredibly strong. You only look for a reversal when the price finally fails to touch the outer band and starts curling back toward the center yellow line.
💡 The Simple Secret
Think of Bollinger Bands as a rubber band. 90% of all price action happens inside the outer bands. Anytime the price forces its way completely outside of the upper or lower band, it is living on borrowed time. Expect it to snap back toward the middle yellow line shortly.

The Trade Became Your Identity
You post the setup online 📲
Clean chart.Nice arrows.Confident caption.
“Watching this long.”“This should run.”“Big move coming.”
People start liking it immediately.
A few replies agree with you.Someone says, “Great setup.”Another trader reposts it.
Now the trade feels bigger than money.
It feels personal.
And THAT’S when things get dangerous.
Because the moment the trade is public… your ego quietly enters the position too 😬
Now price starts moving against you.
Not badly at first.
Just enough to test your stop.
Normally, this should be simple:Trade invalidated → exit.
But now your brain starts negotiating.
“If I stop out now, everyone will see I was wrong.”“Maybe I should give it more room.”“Let me hold a little longer.”
Suddenly you’re not managing risk anymore.
You’re managing embarrassment.
That’s the Public Trade Trap.
The audience changes your behavior.
You stop thinking like a trader and start thinking like a performer.
And performers hate looking wrong publicly 😂
So what happens?
Stops widen.Losses grow.Hope replaces structure.
All because the trade became tied to your image.
Meanwhile the market couldn’t care less about your followers, your tweet, or your reputation.
Price will hit your stop with ZERO emotional concern 😭
Good traders understand something powerful:
A posted trade should still be treated like a PRIVATE decision.
The moment social validation affects your exits, you lose objectivity completely.
And honestly? This happens more than people admit.
Some traders don’t hold losing positions because of analysis.
They hold because they already told the internet they were “convicted.”
That word alone has destroyed so many accounts 😂
Here’s the mindset shift:
Your job is not to look smart publicly.
Your job is to manage risk professionally.
Those are VERY different things.
A disciplined stop-out is not embarrassing.Ignoring your stop to protect your ego is.
Because in trading, being wrong is normal.
Staying wrong because people are watching?
That’s where the damage begins.
So next time you post a trade, ask yourself one uncomfortable question:
“If nobody else saw this position… would I still be holding it right now?”
That answer will tell you whether you’re trading the market…
…or performing for an audience.