Tech Selloff Hits Asia
....................................................................................................................


Good Morning,
We’re starting the week on highly unstable ground. Following a brutal Friday where the Nasdaq sank 4% and the S&P 500 snapped its nine-week winning streak, the board is all over the place. Nasdaq futures are rebounding 0.7% and the S&P 500 is up 0.2%, but Dow futures are sliding 0.3%. The huge weekend headlines are forcing a massive reshuffle between high-flying tech and safe-haven defensive sectors.
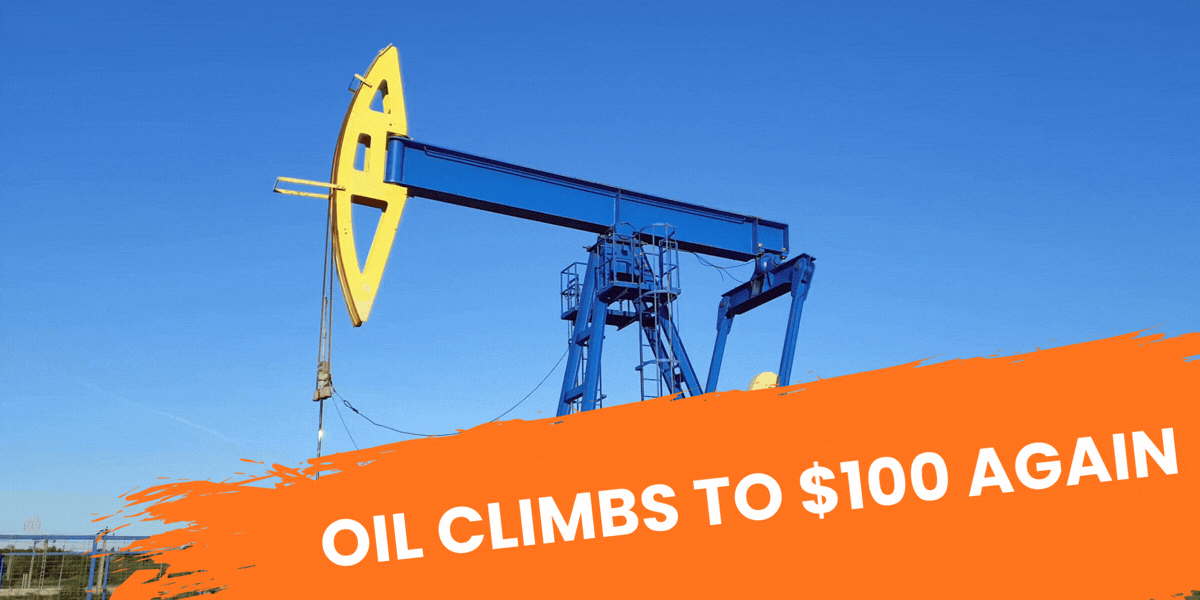
The ceasefire just took a direct hit. In a scary escalation, Iran fired missiles directly at Israel, and Israel immediately launched retaliatory strikes—completely ignoring President Trump’s warnings to stand down. Energy markets went wild on the news: Brent crude surged over 4% past $97 a barrel, while WTI crude topped $94. Traders are terrified that the hard-fought peace deal is completely dead, meaning the Strait of Hormuz could freeze up again.
Inflation data is back under the microscope. Because of this fresh oil spike, everyone is sweating the upcoming Consumer Price Index (CPI) report on Wednesday and the PPI numbers on Thursday. Last week's massive May jobs report already proved the labor market is hot enough to handle higher interest rates. If this week's data shows energy costs are bleeding into everyday prices, the Fed might pull the trigger on a rate hike sooner than anyone wants.
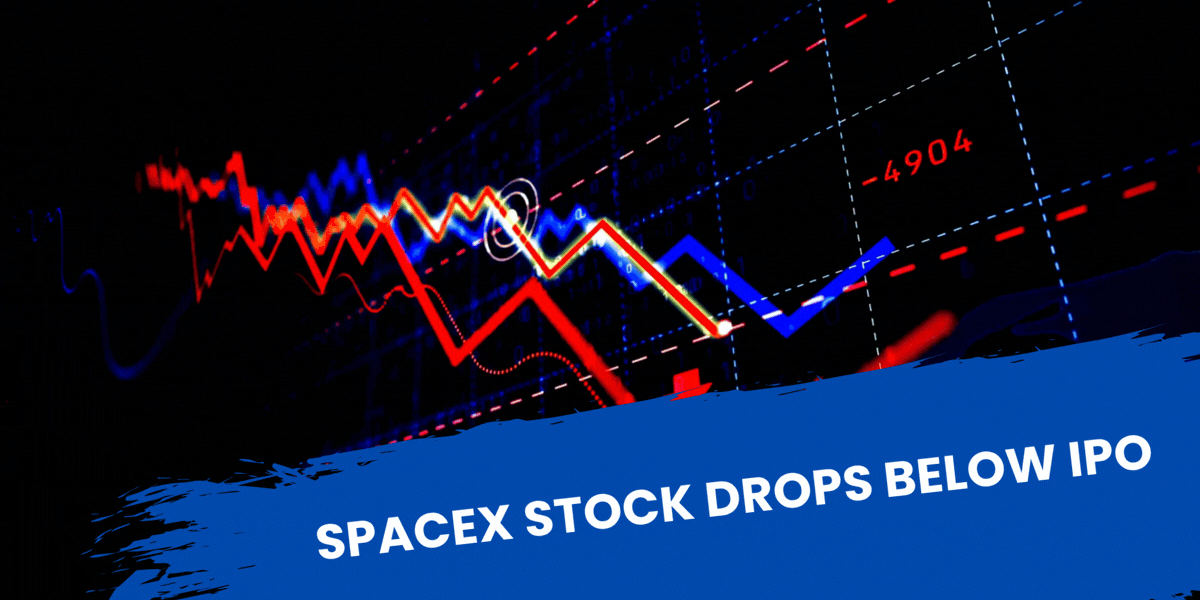
The biggest IPO in history lands this Friday. While macro chaos swirls, the corporate world is gearing up for a monster week.
On Wednesday, Oracle reports earnings, giving us a crucial status update on AI cloud infrastructure. Then on Friday, SpaceX is expected to go public in what will likely be the largest IPO on record. It’s the ultimate test of how much cash institutional investors are willing to pump into Elon Musk’s high-growth space and satellite empire while the rest of the market plays defense.
The tech bulls are trying to fight back, but $97 oil and rocket fire in the Gulf are keeping everyone on edge.

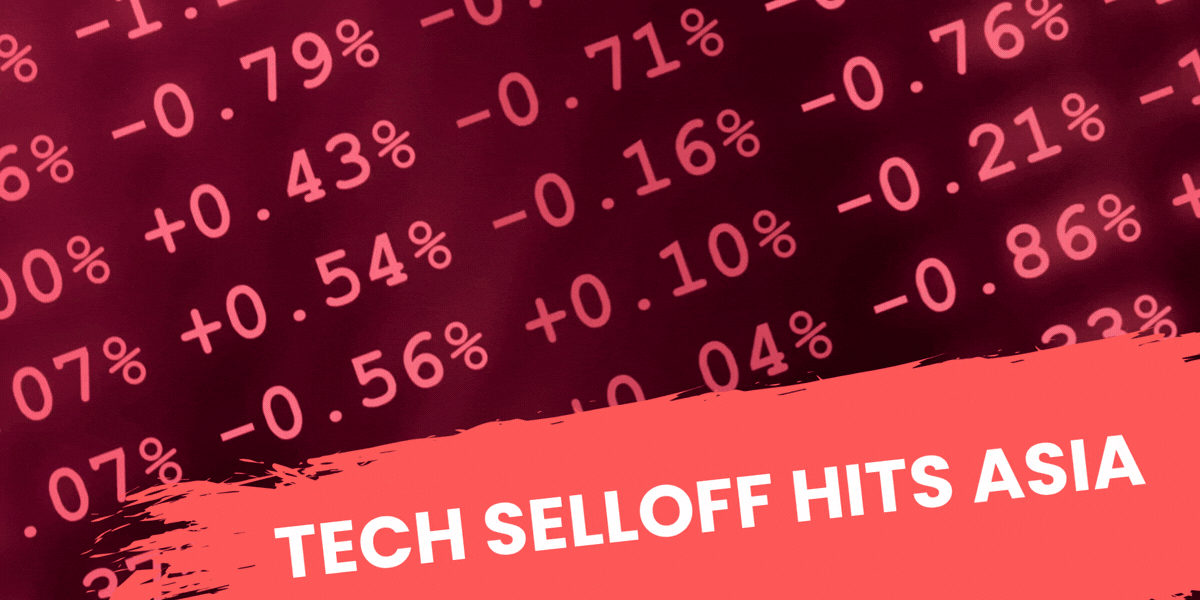
📉 Tech Stocks Plunge in Asia as Trading Halted in South Korea
Asian technology shares suffered a brutal sell-off on Monday morning, forcing the South Korean stock market to trigger an emergency 20-minute trading halt. The dramatic suspension occurred after the benchmark Kospi index collapsed by nearly 9% within minutes of the opening bell, driven by a sharp unwinding of tech positions following fresh military escalations.
⛽ Oil Surges 5% as Iran and Israel Exchange Fire, Threatening Ceasefire
International crude benchmarks jumped sharply on Monday, with Brent soaring 5.1% to $97.83 a barrel and WTI nearing $95. The price spike follows an active exchange of fire between Iran and Israel, fracturing the region's fragile ceasefire. Israel confirmed it targeted military assets inside Iran in retaliation for previous missile attacks, openly bucking President Trump's appeals to hold back.
🤖 Nvidia's Massive $500B Infrastructure Opportunity SolidifiesNvidia (NVDA) remains the ultimate focal point of the artificial intelligence buildout, effectively turning a generative software triumph into an aggressive physical infrastructure race. As hyperscalers, enterprise data centers, and sovereign cloud platforms rush to secure capacity, the hardware giant is successfully turning a massive $500 billion addressable market into tangible pipeline revenue.
₿ Bitcoin Reclaims $63K as Michael Saylor Hints at Fresh Buying
Bitcoin stabilized around $63,000 on Monday morning, staging a 3.8% rebound after breaching the key $60,000 floor late last week. MicroStrategy’s disclosure of a minor token sale—its first since 2022—had previously triggered an 18% weekly drawdown, but a subsequent social media post from Chairman Michael Saylor hinting at heavy corporate accumulation quickly calmed market nerves.
⚠️ Cboe Volatility Index Spikes as Parabolic Semiconductor Wave Hits a Wall
Wall Street's "fear gauge" punched back aggressively on Friday, signaling an end to the non-stop, two-month parabolic rally in semiconductor shares. The brutal correction wiped away significant market capital as the VanEck Semiconductor ETF (SMH) collapsed nearly 10% from its peak, abruptly reversing a frenzy that had pumped half a trillion dollars into tech indexes.
🥇 Gold Falls to Near-Term Lows as Hot Jobs Data Stokes Rate-Hike Fears
Spot gold slid 1% on Monday to settle at $4,287.66 an ounce, continuing a deep 3% retreat that began late last week to touch its lowest valuation since late March. Despite rising Middle East tensions normally boosting safe-haven assets, bullion is being heavily pressured by a blockbuster U.S. employment report that has re-ignited fears of near-term Federal Reserve tightening.
💵 Dollar Scales Two-Month Peak on 70% Chance of a Year-End Fed Hike
The U.S. dollar surged to a two-month high on Monday, with the euro falling to $1.1507 and sterling slipping to $1.3316. Currency traders are aggressively piling into the greenback after a blowout nonfarm payrolls report showed an unexpected addition of 172,000 jobs, prompting fixed-income desks to price in an implied 70% probability of a Fed interest rate increase.

The Rules Might Be Limiting Your Strategy
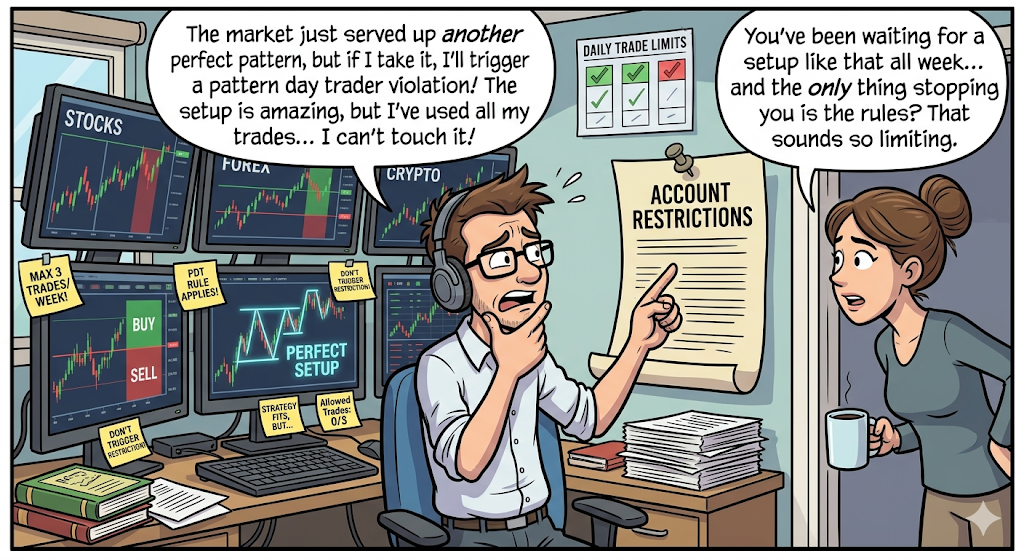
You find a setup. The trade works. Another opportunity appears later in the day.
But you hesitate.
Not because the setup is bad.
Because of the rules.
Many traders run into account restrictions that limit how often they can trade. Suddenly, every entry feels more important. Every decision carries extra weight. Instead of focusing on the market, they start focusing on what they're "allowed" to do.
That’s where frustration builds.
When restrictions influence your decisions, it's easy to force trades, hold positions longer than planned, or pass on valid opportunities because you're worried about using up your flexibility.
Strong traders understand the rules of the accounts they trade. They adapt their strategy to fit the environment instead of fighting against it.
Because a strategy that ignores constraints is incomplete.
When you know your limitations upfront, your decisions become more intentional. You stop reacting to restrictions and start planning around them.
The best traders don't just understand the market.
They understand the game they're playing.
Some traders like learning about the practical realities that affect performance beyond charts and indicators.
If that’s you, you can explore a few market reads here:

Rising Wedge
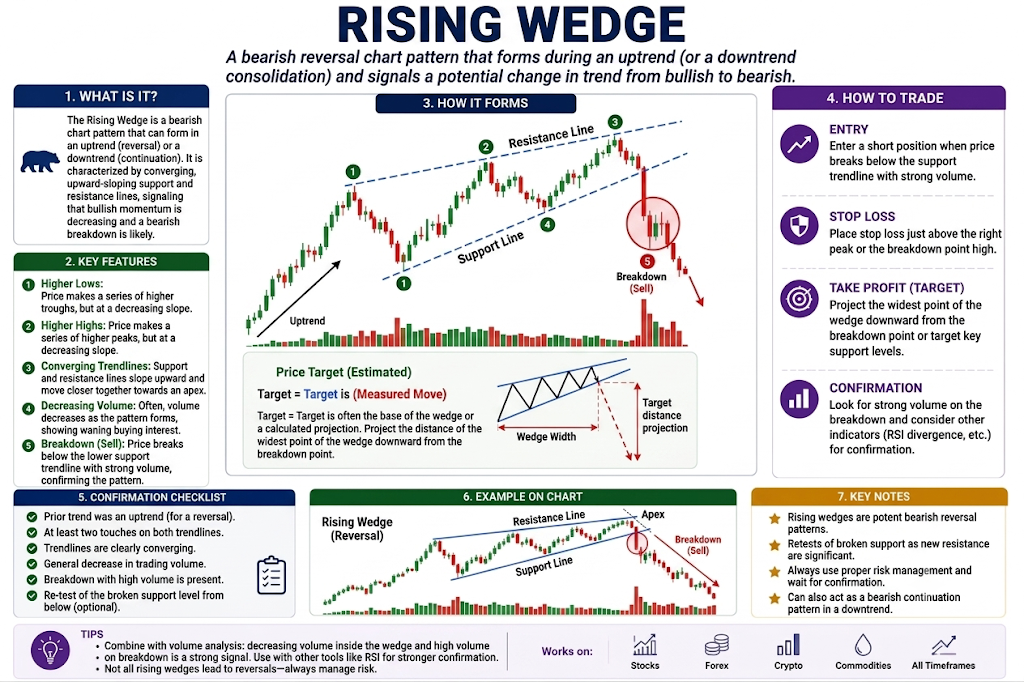
The Rising Wedge is a classic chart pattern that looks like an upward-tilted funnel. It forms when the price makes higher highs and higher lows, but the rallies are getting shorter and more squeezed together. It signals that even though the price is climbing, the buyers are running out of steam, and a sharp downward drop is coming.
🔴 The Red Zone (The High Sloping Line)
The Meaning: This is the top ceiling of the funnel. Every time the price rallies and touches this upper line, it gets instantly rejected. The Move: Stop buying. The price is grinding higher, but it is trapped inside a crowded space where upward energy is stalling.
🟡 The Yellow Zone (The Squeeze)
The Meaning: The price bounces back and forth between the rising ceiling and the rising floor, but the trading space is getting narrower and narrower. The Move: Watch closely. The fact that the buyers can barely push the price to new highs shows they are losing momentum. The market is getting tightly compressed like a coiled spring, getting ready to snap.
🟢 The Green Zone (The Pattern Breakout)
The Meaning: The price finally breaks down through the bottom rising floor line, collapsing out of the funnel. The Move: Go! Blasting downward through that bottom line is your confirmation signal to exit long positions or enter a short trade. The sellers have officially taken over.
🔍 Two Simple Signals to Watch
1. The Tilting Lines
Watch how the top ceiling line and the bottom floor line angle. In a true Rising Wedge, both lines must slope upward, but the bottom floor line must be steeper than the top line.
- The Logic: Because the bottom floor line is climbing faster, it forces the lines toward a collision point. This narrowing space proves that the bulls are struggling to maintain their pace, making an upward breakout highly unlikely.
2. The Volume Clue
Pay attention to the trading volume as the pattern moves up into the tight point.
- The Logic: Volume should steadily shrink as the price gets squeezed, showing that buying interest is drying out at higher prices. When the price finally breaks downward through the floor line, a large surge in volume confirms that big players are aggressively dumping the asset.
💡 The Simple Secret
Think of the Rising Wedge as a tired hiker climbing a steep mountain. Every step up takes a lot more effort but gains very little ground, until the hiker finally collapses from exhaustion. To estimate how far the price will drop after the breakout, look at the very widest part of the funnel where the pattern started—the price will often drop that exact same distance downward from the breakout point.

The Demo Account Hero

On demo?
You’re a machine 😎
Clean entries.
Patient execution.
No emotional mistakes.
You hold winners properly.
Respect stop losses.
Follow the plan like a disciplined sniper.
Honestly, if demo profits paid real bills, you’d probably own an island by now 😂
Then you go live.
And suddenly… a completely different person shows up.
Now you hesitate before entering.
You close winners too early.
You move stops.
You panic during pullbacks that barely mattered on demo.
Same strategy.
Same charts.
Different human.
That’s the shock most traders experience.
The simulator wasn’t testing your strategy.
It was hiding your emotions.
Because demo trading removes the one thing that changes EVERYTHING:
Consequences.
No real fear.
No real pressure.
No real attachment.
Losing fake money feels like dropping Monopoly cash on the floor.
Your nervous system barely reacts.
But once real capital enters the picture?
Now your identity gets involved.
Now every trade feels connected to:
- your goals
- your confidence
- your financial future
- your self-worth
And suddenly simple decisions become emotional negotiations.
That’s why some traders feel “broken” after switching live.
They’re not broken.
They’re finally meeting the psychological side of trading for the first time.
The market is exposing reactions the simulator never could:
- fear of loss
- fear of being wrong
- greed
- impatience
- hesitation
- emotional attachment to money
And honestly?
This phase humbles almost everybody.
Because many traders secretly believe:
“If I know the strategy, I should perform the same live.”
Not true.
Trading knowledge and emotional execution are two completely different skills.
Professional traders understand this.
That’s why they transition slowly:
- smaller size
- controlled risk
- focus on execution over profit
Not because they lack confidence.
Because emotional consistency has to be trained under REAL conditions.
So if live trading suddenly made you feel irrational, emotional, or inconsistent…
Welcome to the real game 🧠
That’s not failure.
That’s where actual trading psychology begins.
And the goal now is not proving you can make money fast.
It’s learning how to stay calm enough to execute your edge while real emotions are sitting in the passenger seat screaming nonsense the entire drive.