Spacex Stock Drops Below IPO
....................................................................................................................


Good morning,
We are opening Friday with deep red across the board. Nasdaq futures are leading the tumble, plunging 2%, while S&P 500 futures are down 1% and Dow futures are dropping 0.7%. The stellar momentum we saw earlier is evaporating as investors rethink how much they are willing to pay for big tech and artificial intelligence.
Netflix is down over 9% after a disappointing outlook. The streaming giant posted solid second-quarter numbers, but its outlook for the upcoming third quarter fell flat. Netflix is forecasting third-quarter revenue of $12.86 billion, missing Wall Street's expectations of $13 billion. As the company navigates a crowded and expensive entertainment market, investors are starting to worry that its hyper-growth phase is slowing down.
The massive chip sell-off is spreading globally. The absolute engine of this year's stock market—the semiconductor and AI trade—is hitting a major wall. Investors are aggressively questioning whether companies are spending too much money on AI without seeing enough immediate profit. The key semiconductor index tumbled over 4% yesterday, and the panic quickly went global overnight: Japan's Nikkei crashed 4% as tech investors rushed for the exit.
Small banks and consumer data wrap up the week. While tech steals the headlines, we are also getting earnings results from regional banks like Truist and Fifth Third to see how local businesses are holding up. Later this morning, we will also get the University of Michigan’s latest consumer sentiment index, which will show how everyday shoppers are handling higher prices at the grocery store and the gas pump.
It is a very defensive, tech-bruised Friday. The bulls are officially on the retreat as the market's favorite growth giants face a serious reality check.

📺 Netflix Tanks Over 9% Premarket as Q3 Revenue Outlook Falls Short
Netflix (NFLX) shares tumbled more than 9% in premarket trading after the streaming giant issued a third-quarter revenue projection that failed to satisfy Wall Street. Stagnant platform engagement trends did little to reassure investors, prompting co-CEO Ted Sarandos to clarify that "not all views are created equal" in an effort to steer investor focus away from raw view hours and toward high-margin financial metrics.
🛢️Oil Edges Up as U.S.-Iran Hostilities Threaten Red Sea Shipping Arteries
Crude prices ticked higher on Friday as escalating military strikes between Washington and Tehran restricted energy exports moving through the Strait of Hormuz. Geopolitical risk premiums expanded further following reports that Iran has urged Yemen's Houthi organization to stand ready to shut down shipping routes in the Red Sea, raising the threat of a dual-gateway maritime blockade.
🌏 Asian Chip Selloff Accelerates as Stellar TSMC Results Fail to Satisfy High Expectations
A bruising retreat in Asian semiconductor stocks gathered momentum after Taiwan Semiconductor Manufacturing Co. (TSMC) reported strong second-quarter numbers that still fell short of Wall Street's extraordinarily high expectations. The lack of a major upward surprise has ignited broad institutional anxiety regarding capital-intensive AI spending and near-term profit margin sustainability.
🇯🇵 SoftBank Plunges Over 9% as Global Tech Selloff Sweeps Through Asian Bourses
Shares of Japanese technology conglomerate SoftBank Group sank more than 9% on Friday, leading a broad-based rout across Asian artificial intelligence and hardware providers. The localized selling pressure closely tracked a weak overnight session on Wall Street, where a deepening correction in U.S. semiconductor stocks triggered heavy systemic de-risking in neighboring Asian tech hubs.
🚀 SpaceX Aborts Starship Test Flight to Slide Below $135 IPO Price Baseline
SpaceX (SPCX) shares lost ground after the aerospace firm abruptly scrubbed a planned orbital test flight of its massive Starship rocket from its South Texas launch facility. The launch failure, which would have marked the second flight of the upgraded Starship V3, added near-term negative momentum to the stock, pushing it below its $135 initial public offering price for the first time since its record-setting June debut.
💵 Dollar Eyes Weekly Loss as Softer Inflation Overpowers Middle East Safe-Haven Bid
The U.S. dollar held steady on Friday but remained on track for a notable weekly decline as foreign exchange desks lower their expectations for near-term Fed interest rate hikes. Although escalating military conflict in the Middle East provided a supportive safe-haven bid for the greenback, it was largely overshadowed by cooler-than-expected consumer inflation data that points to a less hawkish interest rate path.
₿ Bitcoin Spot ETFs Post $368M Three-Day Inflow Streak Amid Token Recovery
U.S. spot Bitcoin exchange-traded funds registered a strong $79.2 million net inflow on Thursday, extending their positive buying streak to three consecutive days. The sudden influx of institutional capital, totaling roughly $368 million over the three-day period, has successfully reinforced a baseline of physical liquidity as Bitcoin attempts to stage a sustained price recovery.

Making More Money Requires More Than a Bigger Position
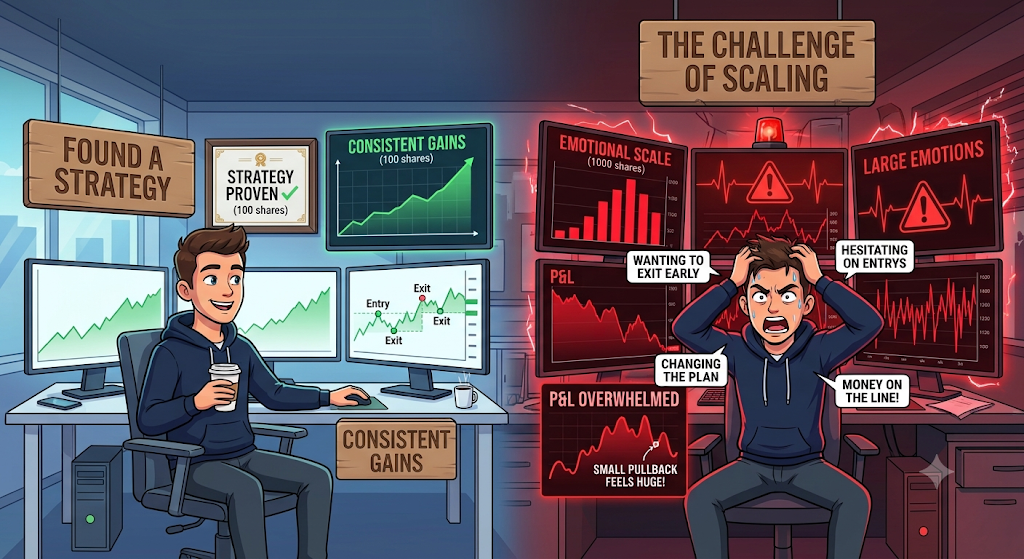
Finding a strategy that works is a big milestone.
Scaling it is a different challenge.
Many traders assume that once they have a proven edge, they can simply increase their position size and earn more. But that's rarely how it works.
Larger positions create larger emotions.
A small pullback suddenly feels uncomfortable. You start watching every tick. You exit early, hesitate on entries, or change your plan because there's more money on the line.
The strategy hasn't changed.
You have.
Strong traders scale gradually. They increase risk in small steps and make sure they can follow the same rules at every level. If discipline changes with position size, they slow down.
Because an edge only works if you can execute it consistently.
When you scale with patience, your confidence grows alongside your account. You don't just build bigger positions.
You build the ability to manage them.
One of the best ways to keep improving is to learn from different market thinkers and approaches.
If you'd like to explore more market perspectives, you can discover a few newsletters here:

Accumulation/Distribution Line (A/D Line)
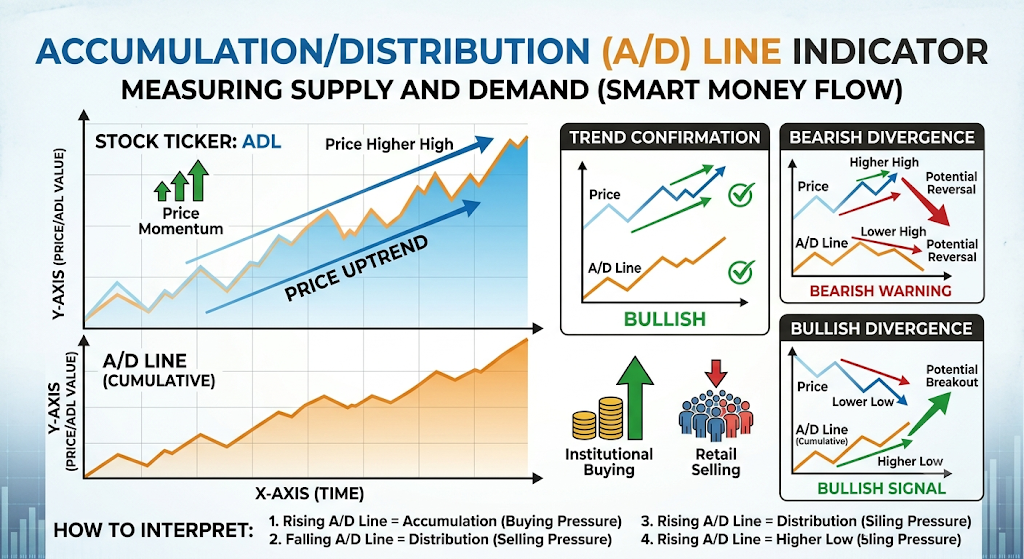
The Accumulation/Distribution (A/D) Line is like a lie detector for chart patterns. While standard indicators only look at whether a day ended green or red, the A/D Line digs deeper: it measures where the price closed relative to its high and low for that day, then multiplies it by volume. It shows whether institutions are quietly buying up (accumulating) or dumping (distributing) an asset behind the scenes.
🔴 The Red Zone (Distribution / Line Slopes Down)
The Meaning: The A/D Line is steadily falling. This means that even if the price is holding up, the daily candles are consistently closing in the bottom half of their trading range on heavy volume.
The Move: Protect your capital. This is a clear warning that big players are using temporary rallies to aggressively sell and exit their positions.
🟡 The Yellow Zone (The Balanced Trend)
The Meaning: The A/D Line is moving sideways or climbing at the exact same pace as the price chart.
The Move: Hold. The price movement is healthy and fully supported by active volume. There are no hidden warning signs or secret institutional buying sprees happening under the hood.
🟢 The Green Zone (Accumulation / Line Slopes Up)
The Meaning: The A/D Line is rising. Even if the price is moving sideways or drifting slightly lower, the daily candles are finishing near the absolute top of their daily range on strong volume.
The Move: Go! This reveals that institutional buyers are aggressively soaking up every available share, establishing a strong floor that will soon launch the price higher.
🔍 Two Simple Signals to Watch
1. The Bearish Divergence Trap
Watch for moments when the price makes a fresh new high, but the A/D Line stubbornly refuses to match it and instead prints a lower high.
- The Logic: This is one of the most reliable warning signs in trading. It proves that the price is being pushed up on very thin, weak retail volume, while major institutions are actively dumping their holdings. A sharp downward trend reversal is usually right around the corner.
2. A/D vs. OBV (The Close-Range Factor)
While On-Balance Volume (OBV) simply looks at the overall close-to-close change, the A/D Line focuses on the battle within the day.
- The Logic: If a stock gaps up massive at the open but spends the entire day crashing down to close near its low, OBV will still count that day as "positive volume" because the close was higher than yesterday's close. The A/D Line, however, will correctly recognize this as heavy distribution and turn sharply downward.
💡 The Simple Secret
Think of the A/D Line as tracking the closing bell power. If a stock closes near the absolute high of the day, it means the buyers completely dominated the final, most important hours of trading when institutions make their moves. By cumulative tracking of these daily closes relative to the daily range, the A/D Line shows you exactly which way the smart money is leaning before the rest of the retail market catches on.

Everything Looks Easy After the Candle Closes
The market closes.
You lean back in your chair, pull up the chart, and start scrolling through the day's price action.
"How did I miss that?"
The breakout was obvious.
The support held perfectly.
The trend was crystal clear.
You start connecting the dots like a detective solving a case that was never really a mystery.
Five minutes later, you've convinced yourself you would've caught the whole move if you'd just been paying attention.
It's a great feeling.
There's only one problem.
None of that confidence existed while the market was actually moving.
Because live trading and replaying a chart are two completely different experiences.
When you're looking at history, there's no uncertainty.
No risk.
No second-guessing.
You already know where price ends up.
Your brain quietly edits out all the confusion that existed in real time.
It forgets the fake breakout.
The messy candles.
The conflicting signals.
The news headline that made everyone hesitate.
All it remembers is the clean ending.
That's why hindsight is such a dangerous teacher.
It whispers,
"You should've known."
No...
You couldn't have known.
You could only have managed probabilities.
There's a big difference.
I've seen traders spend an hour explaining why a move was "so obvious," then completely freeze when a nearly identical setup appears the next day.
Why?
Because yesterday's chart came with answers.
Today's chart comes with uncertainty.
And uncertainty changes everything.
This trap becomes expensive because hindsight creates fake confidence.
You start believing you're seeing patterns more clearly than you actually are.
Then you size up.
Trade more aggressively.
Take setups that don't quite fit.
After all, you've convinced yourself you're "reading the market better now."
Then the next live trade reminds you of a painful truth:
Seeing the answer after the exam doesn't mean you would've passed the test.
So instead of asking,
"How did I miss that move?"
Try asking,
"Would I honestly have had enough information to take that trade in real time?"
That's a much fairer question.
Because your goal isn't to become a champion at explaining yesterday's chart.
Anyone can do that.
Your goal is to make good decisions before the outcome is known.
And that's a completely different skill.
The market doesn't pay you for having perfect hindsight.
It pays you for making disciplined decisions while the ending is still unwritten.