Tech Pauses Rally
....................................................................................................................


Good morning,
We’re starting the day with a slight pullback. Nasdaq futures are leading the slide, down 0.5%, while the S&P 500 and Dow are both down 0.2%. This comes right after a stellar Tuesday that saw the tech-heavy Nasdaq jump over 1.5% and the Dow hit yet another all-time record high. Today, investors are playing it safe as geopolitics and interest rate worries take center stage.
Peace talks in Qatar just hit a frustrating snag. The brief optimism that lifted stocks yesterday cooled down after Iran announced its delegates would refuse to meet directly with President Trump’s team in Qatar. This sudden friction has clouded hopes for a smooth, long-term deal to reopen the blockaded Strait of Hormuz. Ironically, the news caused energy markets to flip, with oil prices dropping about 1% as Brent crude slid toward $72 a barrel, proving just how unpredictable the situation remains.
The big "Jobs Report" lands tomorrow morning. Because the stock market will be completely closed this Friday for the Fourth of July holiday, the highly anticipated June jobs report is coming out a day early, on Thursday morning. Wall Street is hypersensitive to this labor data. If the numbers show the job market is still running too hot, it will give the Federal Reserve all the ammunition it needs to pass a rate hike later this year.
Tech is pausing its big chip rally, and nobody wants to make any massive moves until we see how the labor market looks tomorrow.

📊 Dow Futures Hit Reverse Following Strongest First-Half Rally in Five Years
U.S. stock index futures slipped early Wednesday morning, pointing to a downbeat start for July despite logging exceptional first-half gains. Futures tied to the blue-chip Dow Jones Industrial Average dropped 170 points (0.33%), while S&P 500 futures fell 0.29% and Nasdaq 100 contracts slid 0.34%. The minor retreat follows a powerful late-June closing session where the tech-heavy Nasdaq Composite jumped 1.52% and the S&P 500 rose 0.79% to lock in an incredibly resilient first half of 2026.
🛢️ Oil Wobbles after Brent’s Biggest Monthly Collapse Since Pandemic Era
International crude benchmarks fluctuated on Wednesday morning as a sudden breakdown in direct U.S.-Iran negotiations cast fresh doubt over the Middle East peace process. Oil prices fell initially after Tehran declared it would not meet with U.S. delegates in Qatar, adding friction to the 14-point memorandum of understanding struck on June 17. The geopolitical uncertainty frames a historic month for energy channels, as international benchmark Brent crude futures dropped roughly 21% throughout June, marking its deepest single-month contraction since March 2020.
₿ Bitcoin Logs Worst Month Since 2022 to Renew Near-Term $40K Downside Fears
Bitcoin (BTC) underperformed the broader financial landscape to close out June down 20%, marking its worst monthly stretch since June 2022. The leading cryptocurrency resumed its slide on Wednesday to trade down 1% at $58,644, extending its dismal year-to-date collapse to 33%—a deep divergence from the S&P 500's solid 9% first-half advance—prompting macro strategists to warn of a deeper structural flush toward the $40,000 level.
🖥️ Second-Quarter Chip Rally Adds Staggering $2 Trillion to Micron, Intel, and AMD
A massive, diversified second-quarter hardware rotation added an aggregate $2 trillion in market capitalization to Micron Technology, Intel, and AMD as institutional funds expanded their exposure beyond Nvidia. Memory manufacturer Micron spearheaded the explosive semiconductor charge with a blistering 240% quarterly surge, while Intel shares jumped 216% and Advanced Micro Devices climbed 186% on insatiable underlying AI equipment demand.
🥇 Gold Depressed Near Seven-Month Lows on Hawkish Fed Rate Outlook
Spot gold edged down 0.7% on Wednesday to trade at $3,979.41 an ounce, hovering precariously close to a seven-month low of $3,942.99 touched in the previous session. Bullion prices are facing persistent headwind pressures from rising U.S. Treasury yields, while fading optimism for a permanent Middle East peace pact keeps long-term inflation anxieties elevated and forces fixed-income desks to brace for additional Fed interest rate hikes.z
📈Tepid Outlook Weighs on Nike Despite Massive $986M Tariff Refund Boost
Nike reported earnings that were heavily lifted by a massive $986 million U.S. tariff refund after the Supreme Court struck down a portion of President Donald Trump's trade levies. While the windfall accounting adjustment drove a $1.1 billion quarterly profit—nearly five times higher than the year-ago period—shares sank 2% in after-hours trading due to weak demand in China and a downbeat forward guidance.
🌏 Asian Equities Diverge as Hormuz Shipping Defies Slowing Diplomatic Channels
Bourses across Asia-Pacific mapped out wide performance gaps on Wednesday as two U.S. envoys arrived in Doha for indirect talks with Qatari mediators. Although the S&P/ASX 200 lost 0.4% and South Korea's KOSPI index slid 1.8% on lingering macro anxieties, Tokyo's Nikkei 225 added 0.6% to finish near 70,463.72, as maritime analysts notes that physical vessel transits have yet to recover to their pre-war baselines.

Not Every Market Insight Was Written by a Human
Every day, thousands of market posts, newsletters, and analyses appear online.
Some are thoughtful.
Many are generated in seconds.
AI has made it easier than ever to produce endless market commentary. The problem isn't the technology—it's the volume. The same ideas get repeated. Predictions get recycled. Confident opinions spread faster than careful analysis.
It becomes harder to tell what's actually worth your attention.
That's why many traders feel informed but still make poor decisions. They consume more content than ever, yet gain very little insight.
Strong traders are selective. They don't read everything. They look for sources that explain their reasoning, not just make bold predictions. They spend more time studying the market than scrolling through opinions about it.
Because information isn't the edge.
Good judgment is.
When you filter out the noise, your thinking becomes clearer.
You stop reacting to every headline and start focusing on what actually matters.
Markets evolve, and so do trading ideas. Exploring different perspectives can help you think beyond what worked yesterday.
Discover a few market newsletters here:

The Ascending Triangle
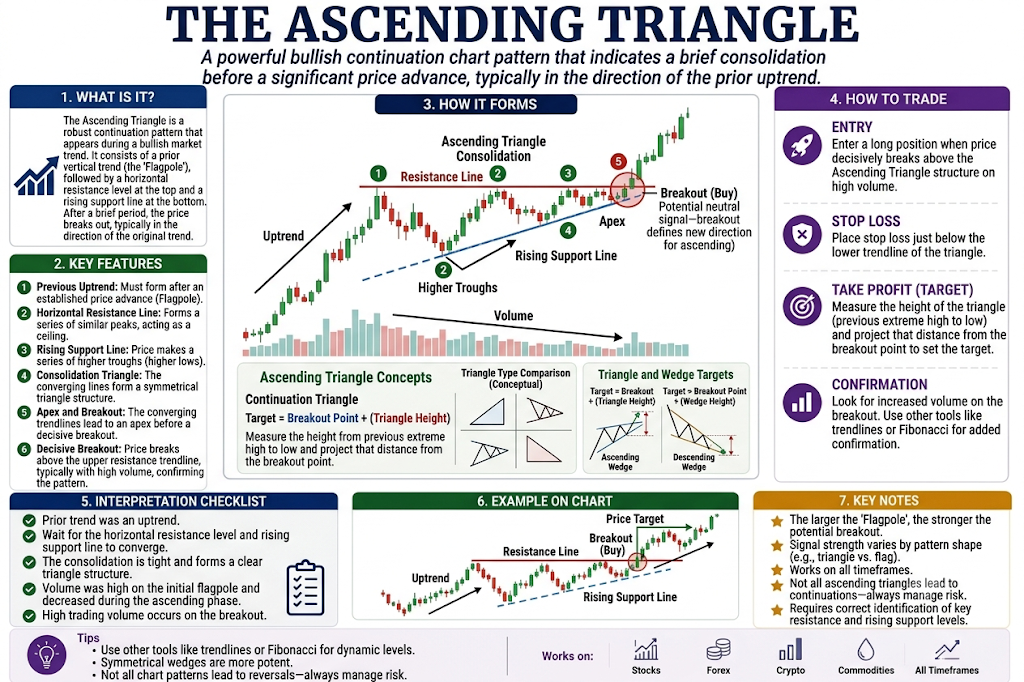
The Ascending Triangle is a bullish chart pattern that looks like a right-angled triangle pointing skyward. It forms when the price hits a flat, horizontal ceiling of resistance at the top, while the pullbacks form a rising line of higher lows at the bottom. It signals that buyers are becoming increasingly aggressive, squeezing the sellers against a wall until the price explodes upward.
🔴 The Red Zone (The Flat Horizontal Ceiling)
The Meaning: This is the top baseline where sellers are sitting. Every time the price rallies to this exact price level, it hits a wall of supply and gets knocked back down.
The Move: Wait. This flat ceiling is a major barrier. Do not buy while the price is trapped beneath it, as the sellers are still actively defending that territory.
🟡 The Yellow Zone (The Rising Floor)
The Meaning: Even though the price keeps getting rejected at the top, each drop is shallow. The buyers step in earlier and earlier every time, drawing an upward-sloping line of higher lows.
The Move: Watch closely. The shrinking space between the flat ceiling and the rising floor means a massive squeeze is happening. The bears are running out of room to push the price down, and the market is preparing to pop.
🟢 The Green Zone (The Horizontal Breakout)
The Meaning: The price finally accumulates enough energy to blast straight up through the flat horizontal ceiling, shattering the pattern.
The Move: Go! A clean close above the horizontal ceiling line is your official green light to buy. This confirms that the buyers have completely cleared out the supply wall and a powerful new upward surge has begun.
🔍 Two Simple Signals to Watch
1. The Volume Accumulation
Pay close attention to how trading volume moves inside the triangle.
- The Logic: Volume should naturally dry up and get quiet as the price gets tightly compressed into the apex (the point) of the triangle. Crucially, when the breakout through the ceiling happens, you must see a massive spike in volume to prove that major institutional buyers are backing the move.
2. The Failed Ceiling Drop
If the price touches the flat ceiling for the third or fourth time and barely drops at all before breaking through, the pattern is highly valid.
- The Logic: A tiny, shallow pullback right against the resistance wall shows that buyers are matching the sellers dollar-for-dollar and refusing to back down. This is an early warning that the ceiling is about to crack.
💡 The Simple Secret
Think of the Ascending Triangle as a hammer hitting a concrete roof. The first hit (the first peak) causes a bounce. The second hit gets closer, and the third hit barely retreats. Each strike makes the roof weaker because the buyers are maintaining relentless pressure. To calculate your target profit zone, measure the vertical height of the triangle at its widest point—the price will very often sprint that exact same distance upward once it clears the breakout line.

You're Not Managing Risk. You're Punishing Yourself
A bad trade happens.
Maybe you broke a rule.
Maybe you didn't.
Either way, it stings.
So the next morning, you make a promise:
"I'm going to be extra careful today."
Sounds responsible.
But then your next setup appears.
It's one of your best.
Everything lines up.
Yet instead of taking your normal position size, you cut it in half.
Or to a quarter.
Or so small that, even if the trade wins, it barely moves your account.
You tell yourself it's "good risk management."
Sometimes it is.
But sometimes...
You're not reducing risk.
You're trying to protect your ego.
There's a difference.
A trader I once spoke with had a strange cycle.
After every losing day, he'd trade tiny for the next week.
Not because his strategy changed.
Not because market conditions changed.
Because he no longer trusted himself.
Ironically, his best trades almost always came during those weeks.
The problem?
They were so small they barely mattered.
Instead of rebuilding confidence, each winner left him thinking:
"If only I'd traded my normal size..."
So now he felt guilty and doubtful.
The punishment never ended.
This is the trap.
We often think confidence comes first.
Then we size normally.
In reality, confidence is built by repeatedly executing your plan—not by hiding from it.
Of course, there are times when reducing size makes sense.
If you're testing a new strategy, trading unusually volatile conditions, or coming back after a long break, smaller size is smart.
But that's not what we're talking about.
We're talking about shrinking yourself because one loss convinced you that you no longer deserve to trade with conviction.
That's an emotional decision wearing the clothes of risk management.
Ask yourself something uncomfortable:
If your best setup appeared right now, would you trade it differently simply because of what happened yesterday?
If the answer is yes...
Yesterday is still trading your account.
Here's a better approach.
Don't let your last trade decide your next position size.
Let your plan decide.
If your rules say risk 1%, risk 1%.
If your rules say this setup deserves full size, give it full size.
Because consistency isn't just about following your entries.
It's about trusting your process enough to treat today's opportunity as today's opportunity.
Not yesterday's punishment.
The market doesn't know you had a rough session.
It doesn't owe you a confidence-building win.
Your job is simply to show up with the same disciplined process, whether the last trade made you feel like a genius...
...or made you question everything.
That's how confidence comes back.
Not through hiding.
But through repetition.