Spacex Target $135/Share
....................................................................................................................


Good Morning,
We’re starting Wednesday with a completely flat board. S&P 500 and Dow futures are hugging the baseline, while the tech-heavy Nasdaq is inching up just 0.1%. After hitting fresh record highs yesterday, Wall Street is taking a breather as the incredible momentum from the AI boom slams right into a fresh wave of uncertainty in the Middle East.
Cybersecurity is the latest AI winner. If you wanted proof that the AI trade is still rock solid, Palo Alto Networks (PANW) delivered it. Their stock rose after hours following an earnings report that showed massive demand for AI-driven security. They join Dell and HPE in proving that the corporate rush to build out and protect AI infrastructure is the strongest floor this market has right now.
But a new hurdle just tripped up the peace talks. Just as President Trump took to social media to reassure everyone that U.S.-Iran negotiations were moving "at a rapid pace," a new wrench got thrown into the gears. Israel’s widening military campaign against Hezbollah in Lebanon has suddenly complicated the truce. Traders are getting nervous again that a final deal to end the war and reopen the blockaded Strait of Hormuz might take a lot longer than hoped.
The "Jobs Marathon" kicks off this morning. While we watch the headlines, the economic data is rolling in. We get the ADP private payroll numbers this morning, giving us our first major clue about labor market strength before Friday's official government jobs report.
More tech heavyweights report after the bell. The earnings season isn't completely done yet. Keep your eyes on Broadcom and CrowdStrike this afternoon to see if chip demand and cloud security can keep the tech rally alive, while Macy’s will give us a pulse check on the everyday retail shopper.
Tech wants to run, but until the geopolitical dust settles, the market is keeping its feet firmly on the brakes.

📊 Wall Street Closes at All-Time Highs as Tech Defies War Headwinds
The S&P 500, Nasdaq, and Dow Jones all climbed to fresh all-time highs as relentless buying in powerhouse technology shares handily outpaced geopolitical anxieties. While macro uncertainty persists, President Trump sought to steady investor nerves by dismissing media reports of stalled communications with Tehran as outright "fake news."
🚀 SpaceX Targets Record-Breaking $75B Capital Raise at $135 per Share
Elon Musk’s SpaceX is seeking to sell 555.6 million shares priced at $135 apiece for its upcoming public debut, aiming to secure a historic $75 billion capital injection. The completely primary offering is set to debut on the Nasdaq on June 12 under the ticker SPCX, establishing a colossal baseline valuation of $1.75 trillion.
₿ Bitcoin Tumbles Below $66K on Flash Geopolitical Escalation
Bitcoin suffered a sharp 7% decline, dropping over $4,500 in its worst single-day session since early February to notch a nine-week low. The digital asset broke through key technical support lines as algorithmic sell programs reacted to reports of fresh military strikes between U.S. and Iranian forces.
🛢️ Oil Rises for Third Session as Dollar Inches Toward 160 Yen
International crude benchmarks marked a third consecutive day of gains after localized Gulf hostilities caused immediate hopes for a Strait of Hormuz breakthrough to fade. The renewed friction sent safe-haven capital rushing back to the greenback, pushing the U.S. dollar index to the absolute precipice of the 160-yen intervention line.
🤖 SoftBank CEO Masayoshi Son Visualizes Trillion-Dollar 'Physical AI' Industry
Investors are aggressively boosting allocations into humanoid robotics, betting the tech will fundamentally reshape heavy industry and domestic settings over the next decade. SoftBank chief Masayoshi Son highlighted the shift, stating that physical AI and integrated robotics are where the market's next multi-trillion-dollar enterprises will emerge.
🌏 Nikkei Sets Record High as Asian Bourses Look Past Gulf Woes
The Tokyo Nikkei 225 surged to an all-time record on Wednesday, steering a broader advance across the Asia-Pacific region. Despite defensive pricing across commodity channels, equity traders intentionally looked past the structural friction of the U.S.-Iran negotiations to pile back into export-heavy electronics and semiconductor players.
🇬🇧 UK Small-Caps Eye Valuation Buffers Amid Broad China Export Slump
While the FTSE 100 and FTSE 250 trended lower due to a soft manufacturing and trade print out of China, London’s micro-cap ecosystem is exhibiting localized resilience. Investors looking to insulate portfolios from institutional global headwinds are increasingly screening UK penny stocks backed by strong balance sheets and domestic cash flows.

The Relationships You Trust Can Break Overnight
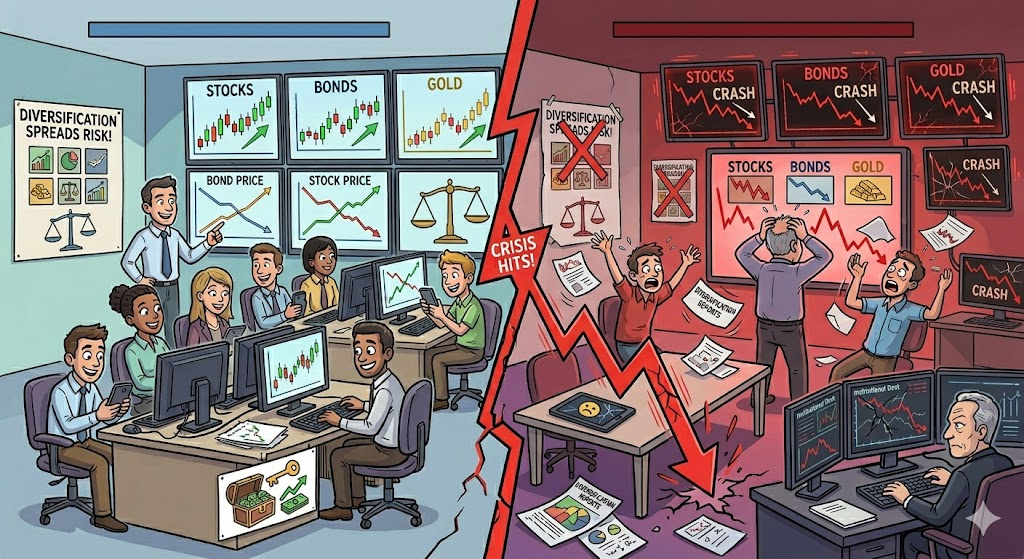
Many traders build confidence around patterns.
Stocks move one way. Bonds move another. Gold reacts predictably. Certain assets usually balance each other out.
Until a crisis hits.
When fear floods the market, normal relationships can stop working. Assets that usually move differently start falling together. Diversification suddenly feels less protective than expected.
That’s where traders get surprised.
They thought they were spreading risk. In reality, they were relying on correlations that only existed in normal conditions.
Strong traders understand that market relationships are not permanent. They change with sentiment, liquidity, and uncertainty. What worked during calm periods may not work during stress.
Because markets behave differently when everyone rushes for the exit at the same time.
When you recognize that correlations can shift, your risk management becomes more realistic. You stop assuming yesterday’s relationships will automatically hold tomorrow.
In a crisis, even familiar patterns deserve a second look.
Some traders like exploring how markets behave during periods of stress and why familiar patterns sometimes disappear.
If that’s you, you can explore a few market reads here:

Falling Wedge
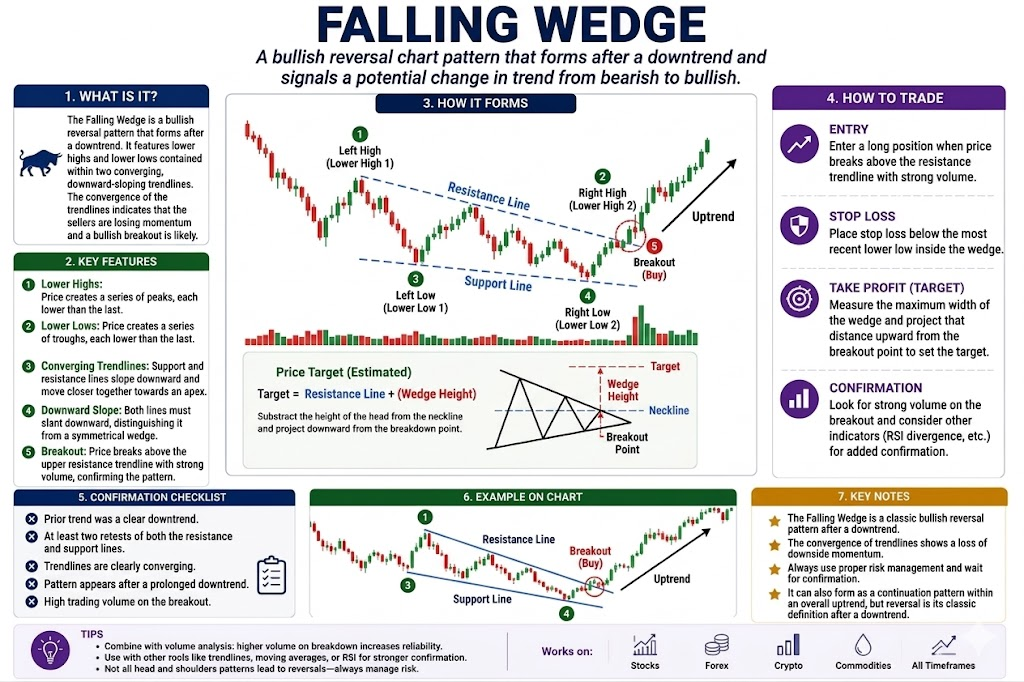
The Falling Wedge is a classic chart pattern that looks like a funnel angled downward. It forms when the price makes lower highs and lower lows, but the drops are getting smaller and smaller, squeezing the price into a tight point. It signals that even though the price is falling, the sellers are losing their grip, and an explosive upward breakout is coming.
🔴 The Red Zone (The High Sloping Line)
The Meaning: This is the top ceiling of the funnel. Every time the price rallies and touches this line, sellers step in to push it back down. The Move: Wait. This upper line is the ultimate barrier. You cannot buy the asset while it is trapped underneath this ceiling, as the overall direction is still moving downward.
🟡 The Yellow Zone (The Squeeze)
The Meaning: The price bounces back and forth between the top ceiling and the bottom floor, but the distance between them is getting narrower and narrower. The Move: Watch closely. The fact that the price isn't falling as fast as it used to shows that sellers are running out of steam. The market is getting tightly compressed like a coiled spring, waiting for a trigger.
🟢 The Green Zone (The Pattern Breakout)
The Meaning: The price finally blasts straight up through the top ceiling line, breaking completely out of the downward funnel. The Move: Go! This is your confirmation signal to buy. Breaking the upper line proves that the buyers have completely overwhelmed the remaining sellers and a fresh upward trend has officially begun.
🔍 Two Simple Signals to Watch
1. The Converging Lines
Watch how the top ceiling line and the bottom floor line tilt. In a true Falling Wedge, both lines must slope downward, but the top line must be steeper than the bottom line.
- The Logic: Because the top line is steeper, it forces the lines to head toward a collision point. This narrowing space proves that the bears are losing momentum on each drop, making a downward collapse highly unlikely.
2. The Volume Drop and Spike
Pay close attention to the trading volume as the pattern develops and when it finally breaks out.
- The Logic: Volume should steadily shrink as the price gets squeezed into the tightest part of the wedge, showing that selling interest is dying out. Crucially, the final breakout above the top line must happen with a large surge in volume to prove big buyers are driving the move.
💡 The Simple Secret
Think of the Falling Wedge as a vocal crowd losing its voice. The sellers are screaming to push the price down, but each scream gets quieter than the last. To estimate how far the price will rally after the green light breakout, look at the very widest part of the funnel where the pattern started—the price will often rally that exact same distance upward from the breakout point.

The Indicator That Feels Like “Home”

Every trader has that one indicator.
The old favorite.
Maybe it’s RSI.
Maybe it’s MACD.
Maybe it’s some strange custom indicator from 2021 that looked like it was designed by a sleep-deprived alien engineer 😂
You stopped using it months ago.
Maybe because it stopped helping.
Maybe because your strategy evolved.
But then trading gets hard again.
A few losses hit.
Confidence drops.
The charts start feeling unfamiliar.
And suddenly… you go back to it.
Not because you tested it again.
Not because it objectively improved your edge.
Because emotionally?
It reminds you of a time when you FELT good at trading.
That’s the part most traders never notice.
Sometimes we don’t return to old tools because they work.
We return because they feel safe.
That indicator becomes tied to a memory:
- a profitable month
- a confident version of yourself
- a period where trading felt simpler
So the brain quietly says:“Maybe this is what I’ve been missing.”
But often, it’s not clarity you’re chasing.
It’s comfort.
And comfort is dangerous in trading because it can disguise itself as logic.
You’ll convince yourself the signals “still look clean.”
You’ll suddenly see setups everywhere again.
You’ll feel relief just having the tool back on your screen.
Meanwhile nothing actually changed about your execution, discipline, or risk management.
This happens outside trading too.
People go back to old habits, old routines, even old relationships because familiarity feels emotionally easier than uncertainty.
Trading is no different.
The market changes.
You change.
Your strategy evolves.
And sometimes the hardest thing to accept is that confidence cannot come from a tool anymore.
It has to come from process.
From repetition.
From data.
From experience earned the hard way.
Not from recreating the emotional atmosphere of your “good old trading days.”
So here’s a question worth asking yourself the next time you resurrect an old indicator:
“Am I using this because it improves my decisions… or because it temporarily makes me FEEL safer?”
Be honest with that answer.
Because a surprising amount of trading psychology is really just nostalgia wearing a technical-analysis costume.