Amazon Hits $3T Valuation
....................................................................................................................



Good morning!
We’re starting the day on a positive note for most of the market. Dow futures are up 172 points (0.3%) and S&P 500 futures are up 0.4%. Meanwhile, tech-heavy Nasdaq futures are holding flat as investors digest a mixed bag of corporate earnings from big-name growth companies.
SpaceX and AMD stumble after earnings.
Elon Musk’s space company, SpaceX, saw its stock sink 11% after releasing its first quarterly report since going public. Even though revenue beat expectations, investors were spooked by its massive spending: capital expenditures skyrocketed sixfold to $18.4 billion, with the vast majority going into artificial intelligence. Microchip maker AMD also dropped 7% in pre-market trading after its quarterly profits barely beat estimates, leaving growth-hungry traders wanting more.
Disney provides a big boost.
Balancing out the tech drops, Disney gained over 3% in pre-market action after reporting strong fiscal third-quarter earnings, helping keep the Dow in positive territory.
Building on a historic record high.
Today’s steady open follows a massive Tuesday rally that sent markets into the history books. The S&P 500 surged 1.8% to cross 7,700 for the very first time, while the Dow surged over 900 points to lock in another all-time record close. That huge rally was driven by comments from Treasury Secretary Scott Bessent, who signaled that the U.S. and Iran are getting closer to a deal to reopen the crucial Strait of Hormuz shipping lane.
Oil ticks back up slightly.
After dropping significantly on the Middle East peace news on Tuesday, energy prices are seeing a minor bounce this morning. Brent crude is up 1.6% to around $80.60 a barrel, while U.S. crude is holding near $76.30.
It’s an overall confident Wednesday morning. The broader market is happily riding Tuesday's record highs, even as massive AI spending forces a few individual stock favorites to take a temporary hit.

📊 Dow Surges 900 Points, S&P 500 Tops 7,700
Wall Street logged record highs on Tuesday, driven by strong earnings and falling oil prices amid growing hopes for a Strait of Hormuz reopening. The S&P 500 crossed 7,700 for the first time while the Dow jumped 900 points.
🚀 SpaceX Dives 10% on Massive AI Capex Surge
SpaceX shares dropped 10% after Q2 capital expenditures surged sixfold to $18.4 billion for AI infrastructure. Elon Musk pulled forward the company's $1 trillion revenue target to 2030 to reassure anxious investors.
🛢️ Oil Rebounds After Houthis Attack Saudi Tanker
Crude prices snapped a two-day decline as a Houthi attack on a Saudi tanker in the Red Sea dented Middle East de-escalation hopes. Brent crude gained 1.35% to $80.43 a barrel, while WTI rose to $76.22.
💻 AMD Plummets 8% Premarket Despite Earnings Beat
AMD shares fell 8% in premarket trading on Wednesday. Although Q2 results cleared official consensus estimates, they fell short of higher buy-side expectations, prompting profit-taking after a massive 132% year-to-date run.
🌏 Asian Markets Rally as Tech Demand Bounces Back
Asian equities extended their rebound Wednesday, tracking record closes on Wall Street. Tech shares led the recovery as investors returned to the sector following progress on talks to reopen the Strait of Hormuz.
🚀 SpaceX Slides Premarket Over Nvidia Chip Deal Questions
SpaceX stock slipped 7.5% in extended trading after analysts questioned whether a new Nvidia compute deal signals a pivot away from Tesla silicon. Despite the pullback, Elon Musk reiterated support for a long-term $10 trillion bull case.
📦 Amazon Dips After Hitting $3 Trillion Valuation
Amazon shares dipped overnight shortly after crossing the $3 trillion market cap threshold. The move followed regulatory filings showing founder Jeff Bezos plans to sell roughly 15 million shares, lowering his stake to 8.1%.

High Volume Doesn't Always Mean a Good Trade
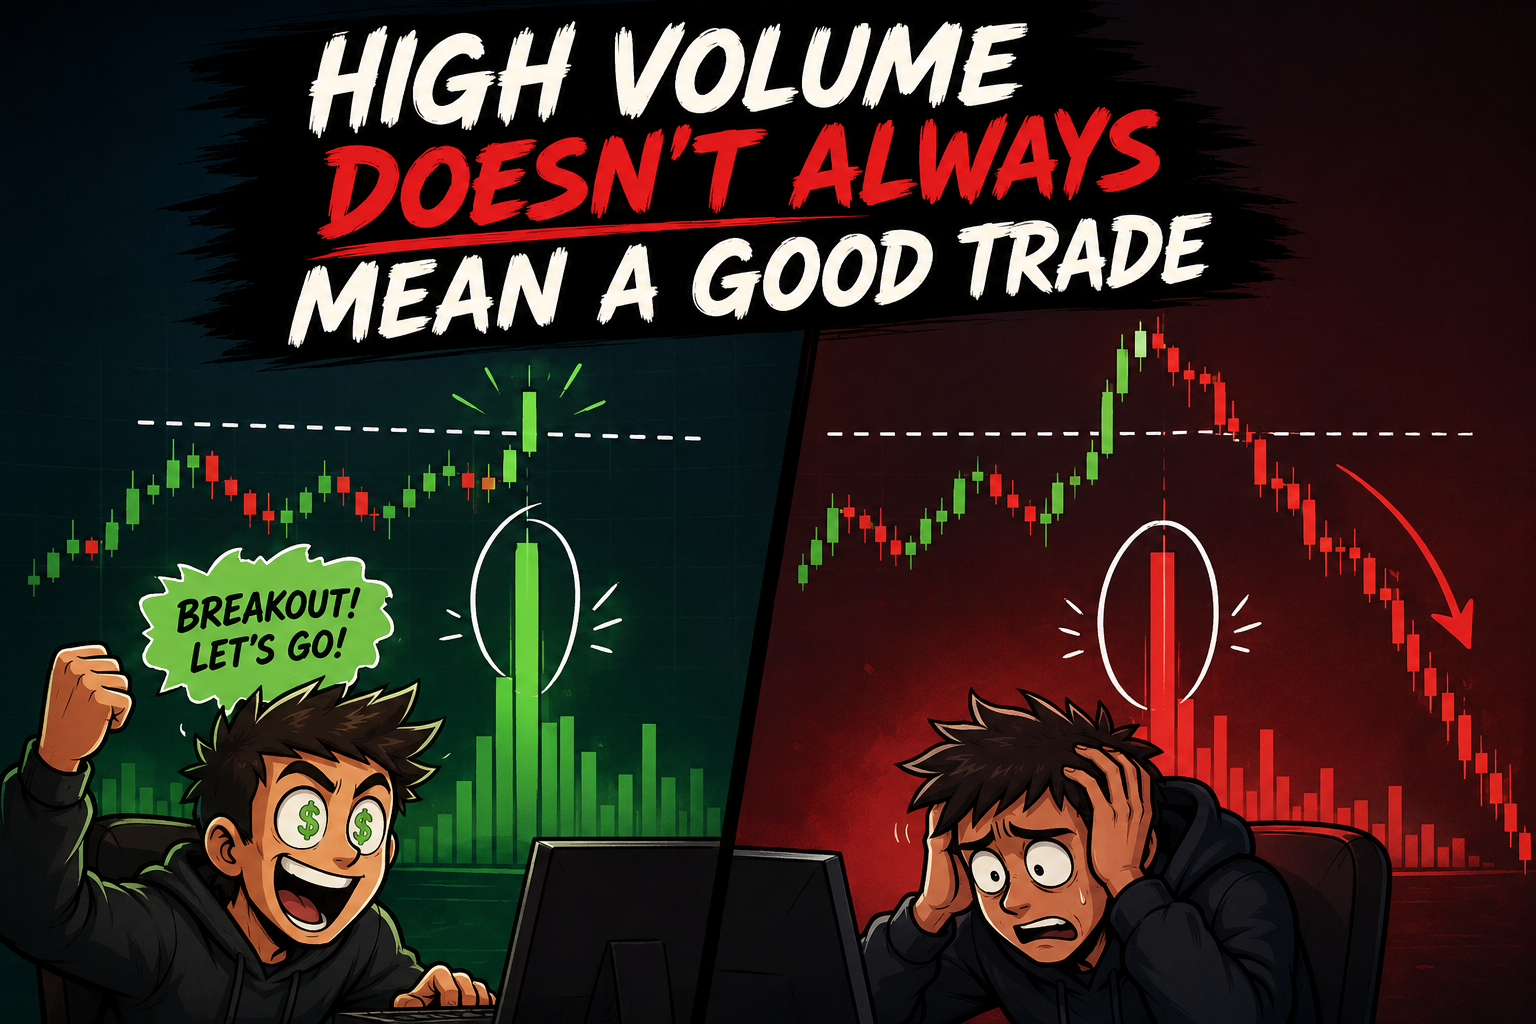
The breakout happens.
Volume spikes.
Everyone starts buying.
It feels like confirmation.
But is it?
Many traders treat high volume as an automatic buy signal. They assume more activity means the market agrees with them. Sometimes that's true.
Sometimes it's the exact opposite.
A surge in volume can signal strong conviction—but it can also mark profit-taking, panic selling, or the final burst before a reversal. Volume tells you that something is happening. It doesn't tell you what.
Strong traders never look at volume in isolation. They ask where it appears, what price is doing, and whether it supports the bigger market picture. Context matters more than the number itself.
Because volume is a clue.
Not a conclusion.
The next time you see a volume spike, don't assume the market is confirming your trade.
Take a step back and ask what that activity actually means.
The best traders don't just notice volume.
They know how to interpret it.
Volume, price action, and market structure all tell different parts of the story. Reading a range of thoughtful market perspectives can help you put the pieces together.
Explore a few market newsletters here:

Diamond Top
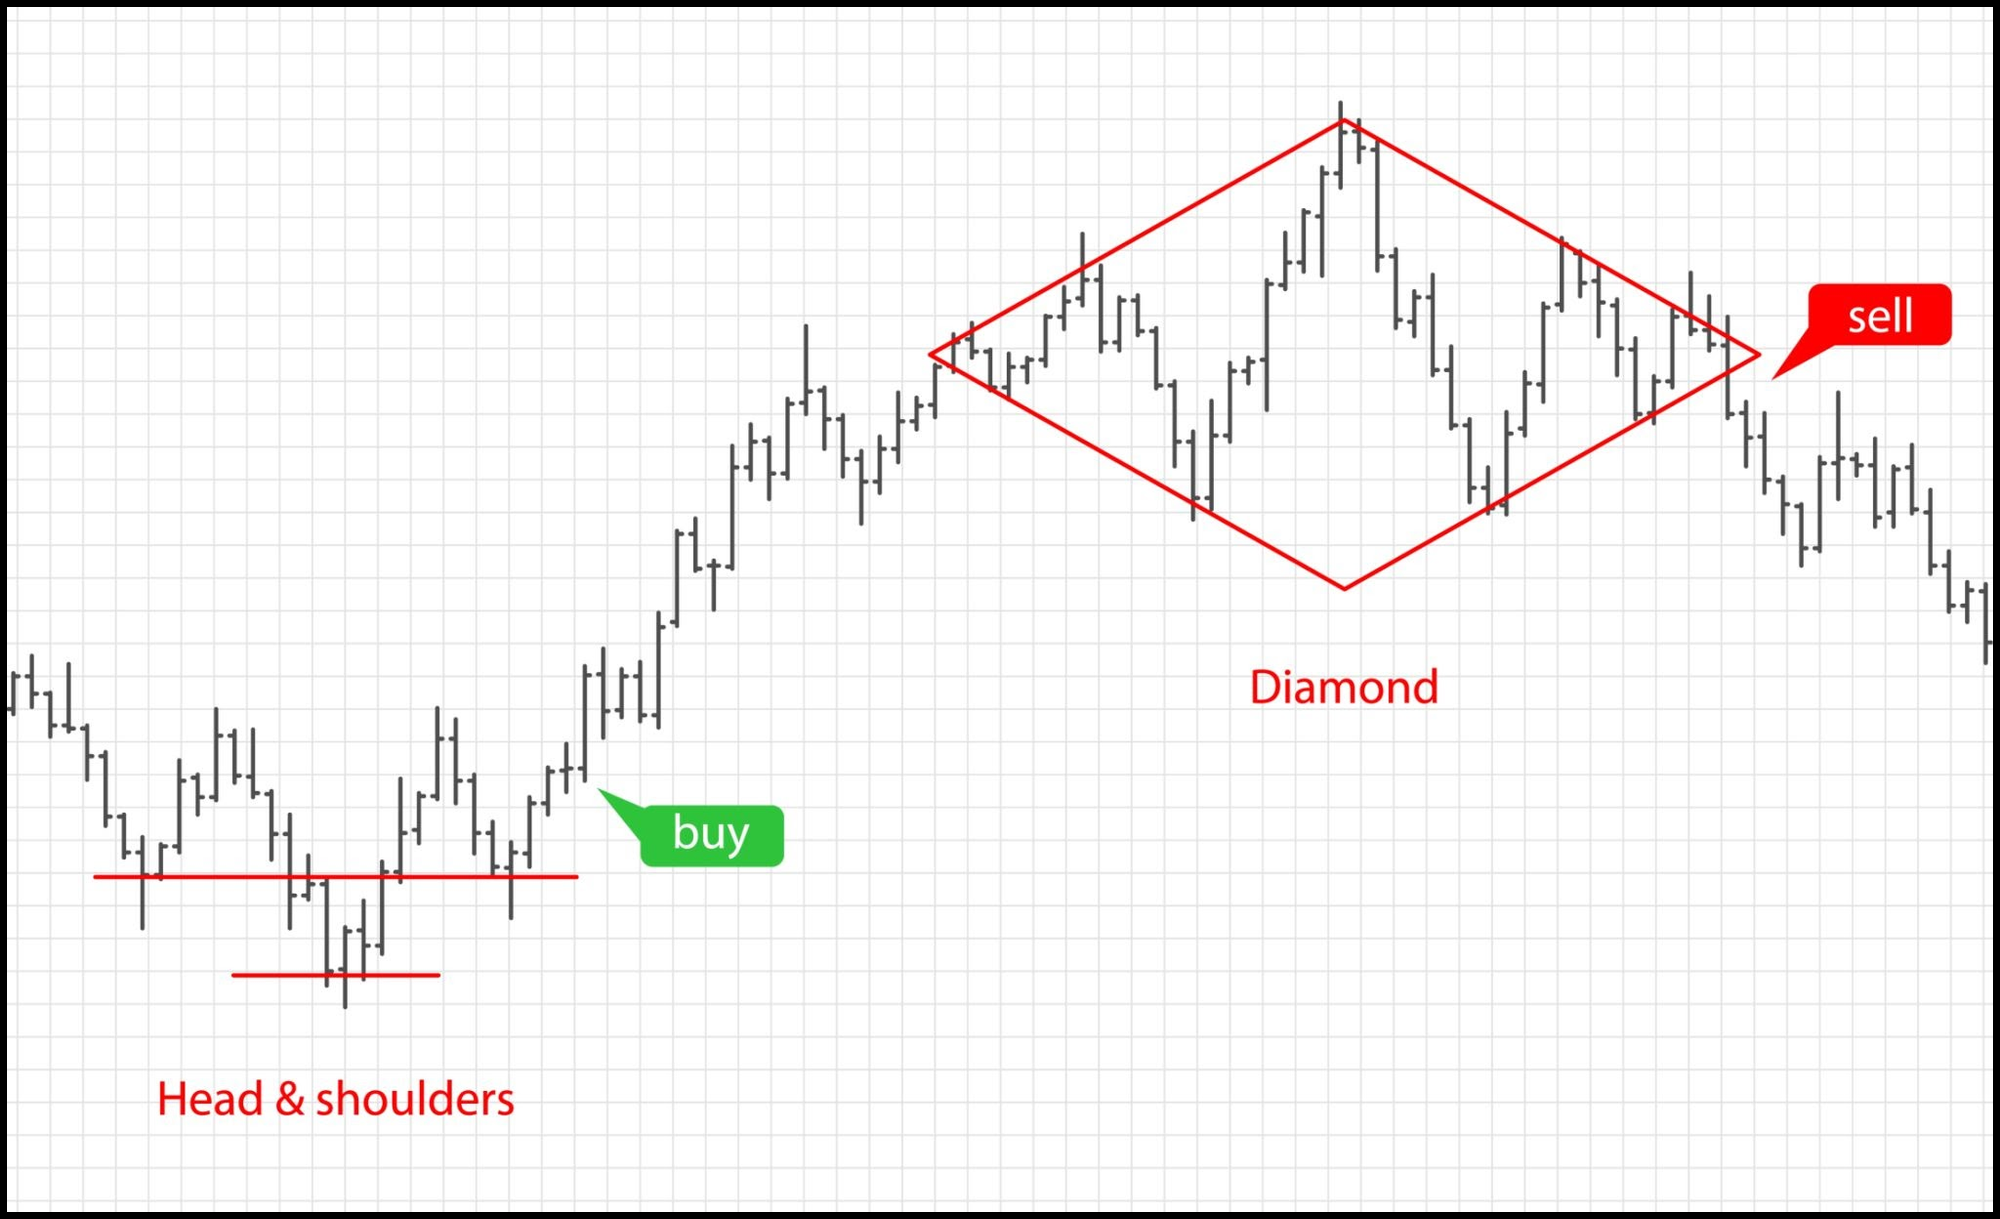
Diamond Top Reversal and Breakdown Structure. Source: all_is_magic / Getty Images
The Diamond Top is a rare, powerful bearish reversal chart pattern that forms at the peak of an extended uptrend. It looks like a combination of a Broadening Pattern (widening price swings) merged into a Symmetrical Triangle (narrowing price swings). It signals that market control is destabilizing, moving from wild, unpredictable volatility to a tight squeeze right before buyers completely surrender.
🔴 The Red Zone (The Left Broadening Expansion)
The Meaning: The price begins making aggressive higher highs and lower lows. Volatility explodes as buyers and sellers fight for control, spreading the price boundary outward like a Megaphone pattern.
The Move: Exercise extreme caution. The market is becoming highly unstable. Do not open new long positions here, as the expanding price swings show that institutional control is fragmenting at the top.
🟡 The Yellow Zone (The Right Symmetrical Squeeze)
The Meaning: After hitting its absolute highest peak in the center of the diamond, the volatility suddenly flips. The price swings contract into smaller lower highs and higher lows, coiling into a tight triangle.
The Move: Watch closely. The market is running out of steam. The tight consolidation shows that buyers are no longer pushing higher, and a massive breakout energy is building up inside the right-hand corner of the diamond.
🟢 The Green Zone (The Lower Support Breakdown)
The Meaning: The price drops to the lower-right upward-sloping support line of the diamond and breaks cleanly through it.
The Move: Go! A clean close below the lower-right support boundary line is your official green light to exit long positions or enter a short trade. It confirms that the buyers have completely given up and a major downward trend has officially triggered.
🔍 Two Simple Signals to Watch
1. The Volume Shift (Expansion to Dry-Up)
Keep a close eye on trading volume throughout the two halves of the diamond.
- The Logic: Volume will typically spike and stay erratic during the chaotic left side (the broadening phase). Crucially, volume should steadily dry up to near-zero levels as the price gets squeezed into the right tip. When the downward breakdown happens, you must see a sudden volume spike confirming institutional dumping.
2. The Broken Support Line Retest
After snapping through the lower-right boundary, the price will frequently pull back to test that line from underneath.
- The Logic: The old diagonal support line of the diamond flips into a fresh ceiling of resistance. A failed bounce off this line provides an exceptionally safe, low-risk entry point for a short trade.
💡 The Simple Secret
Think of a Diamond Top as a head-and-shoulders pattern with V-shaped necklines. The left side represents a wildly out-of-control market, while the right side shows momentum rapidly dying out. To calculate your target profit distance after the breakdown, measure the maximum vertical distance from the highest peak in the center down to the lowest trough in the center—the price will very often drop that exact same vertical distance once it escapes the bottom-right line of the diamond.

If Everyone in the Group Loves the Trade... Be Careful
There's something incredibly comforting about seeing everyone agree with you.
You post a chart in the group.
Within minutes, the replies start rolling in.
"Bullish."
"I'm already long."
"Easy buy."
"Targeting new highs."
Instantly, your confidence doubles.

Not because your analysis improved...
Because your opinion now has company.
It feels like you've done more research.
In reality, you've just collected more people who happen to think the same way.
That's a dangerous distinction.
One trader told me he stopped questioning his trades whenever the group chat agreed with him.
"If ten experienced traders all see the same thing," he said, "how can it be wrong?"
The answer?
Very easily.
Because markets don't care how many people share an opinion.
They only care where the orders are.
And here's the part most traders never notice.
Trading groups often become echo chambers.
The first person posts a bullish chart.
The second person sees the same thing.
The third doesn't want to sound negative.
By the tenth message, it feels like the market has already decided.
But has it?
Or has the group simply reinforced one another's beliefs?
Psychologists call this groupthink.
People stop challenging ideas because agreement feels safer than disagreement.
It happens in businesses.
It happens in politics.
And it definitely happens in trading communities.
That's why the smartest trader in the room isn't always the loudest one.
Sometimes it's the person quietly asking,
"What if we're all wrong?"
Not because they're negative.
Because they're protecting themselves from blind spots.
Here's a habit that can completely change the way you trade.
Before you enter a position everyone seems to love, force yourself to write down three reasons not to take it.
Not one.
Three.
If you struggle to find any, that's usually a sign you haven't been thinking independently.
You've been absorbing the mood of the room.
There's nothing wrong with learning from a community.
Some of the best ideas come from sharing perspectives.
But don't confuse agreement with evidence.
They're not the same thing.
The market has a habit of embarrassing crowds.
Not because crowds are always wrong...
...but because confidence spreads through a group much faster than critical thinking.
So the next time your group chat is celebrating the "obvious" trade of the day, don't rush to join the chorus.
Pause.
Look at the chart again.
And ask yourself one simple question:
"If nobody had shared this idea first... would I still take this trade?"
Your answer will tell you whether you're following your process...
...or simply following the crowd.