Spacex Stock Drops After Rally
....................................................................................................................


Good Morning,
The markets are hitting the pause button this Monday as Wall Street catches its breath after a long holiday weekend.
We’re kicking off the week with a completely muted open. Following Friday’s holiday closure, stock futures are flatlining: S&P 500 futures are down a tiny 0.1%, while Nasdaq and Dow contracts are hovering right at the baseline. Investors are stepping back to evaluate a massive pile of geopolitical news, a European political crisis, and a critical inflation test looming later this week.
The 60-day peace roadmap is giving investors hope. On the geopolitical front, things are actually looking up. Tehran reported "encouraging progress" from the U.S.-Iran peace talks in Switzerland, locking in a roadmap to finalize a permanent treaty within the next 60 days. This breakthrough is taking a lot of heat off the market, especially after President Trump recently threatened direct military strikes if Iran didn't rein in Hezbollah. With diplomacy winning out, oil prices are sliding down with Brent crude dropping to $79 a barrel, fueling hope that the blockaded Strait of Hormuz will soon return to normal operations.
Across the pond, Downing Street is in absolute chaos. Giving global investors a fresh jolt, U.K. Prime Minister Keir Starmer officially resigned this morning after buckling under intense political pressure. The news has sent the British pound tumbling to its lowest level of 2026. With intraparty rival Andy Burnham pegged as the frontrunner to take over, Wall Street is warily watching to see how a massive U.K. fiscal policy shift might ripple through international markets.
But the real main event lands this Thursday. Everything on Wall Street right now is just a warm-up for Thursday’s release of the May Personal Consumption Expenditures (PCE) price index—the Fed's absolute favorite way to track inflation. Economists are expecting core PCE to show a modest acceleration. Because new Fed Chairman Kevin Warsh just took a highly aggressive, hawkish stance at the last meeting, any sign of stubborn inflation will completely lock in expectations for a rate hike later this year.
The geopolitical noise is quietings down, but until that PCE data drops on Thursday, nobody wants to make a heavy bet.

🌏 Asian Markets Swing Higher as Iran Cites Diplomatic Progress with U.S.
Asian equity markets advanced on Monday morning after Iranian negotiators confirmed key progress during bilateral peace talks with the United States in Switzerland, helping calm pervasive fears that the delicate ceasefire framework was fracturing. Mediators from Qatar and Pakistan issued a joint statement revealing that Washington and Tehran have agreed to a concrete, 60-day roadmap targeting a final peace treaty, cushioning global sentiment after an opening session overshadowed by a temporary weekend closure of the Strait of Hormuz and fresh threats of military action from President Trump.
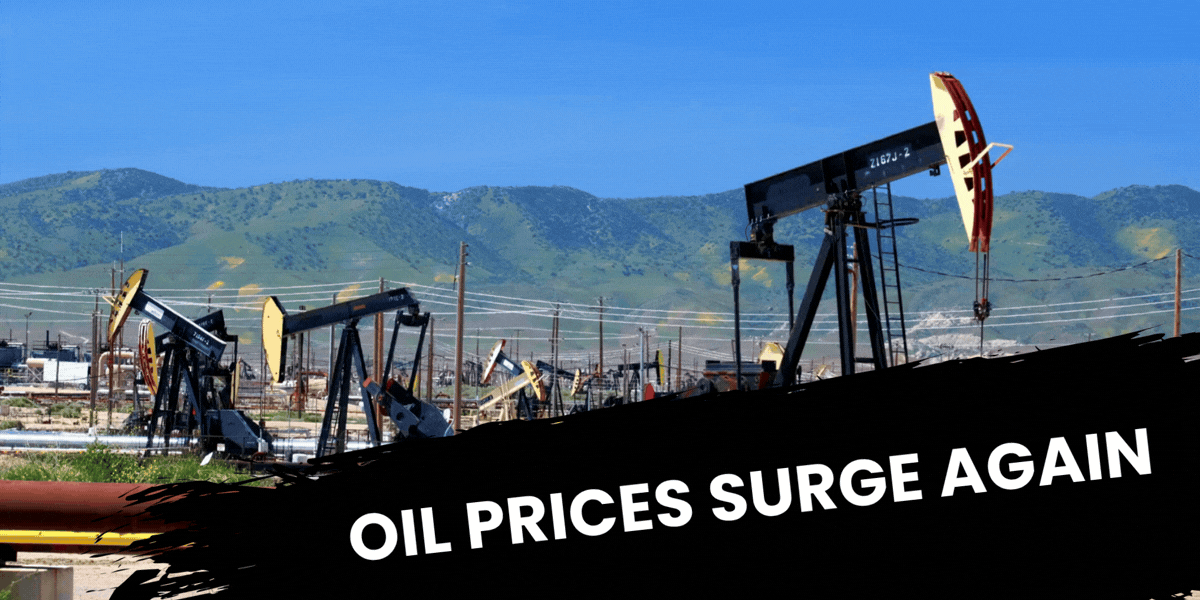
🛢️ Oil Erases Gains as Reopening Roadmap Outweighs Trump's Weekend Threats
International crude futures shed early gains on Monday, with benchmark Brent retreating over 2% to trade near $78.89 a barrel and U.S. West Texas Intermediate stabilizing around $77.52. Energy desks rapidly pivoted to selling mode as the newly structured 60-day maritime de-escalation map neutralized immediate supply-shock panic, heavily undermining a brief price spike triggered by Iran's brief weekend shipping halt and President Trump's immediate warnings to resume defensive strikes.
Gold Rebounds from One-Week Lows as Easing Crude Deflates Yield Curve
Spot gold advanced 0.4% to $4,176.34 an ounce, clawing back from a sharp multi-day decline to snap a deep one-week low. The precious metal derived structural support from the cooling energy sector, as falling crude oil benchmarks directly tempered market-wide inflation concerns; however, bullion's overall recovery remains tightly capped as hawkish Federal Reserve projections prompt fixed-income traders to price in an 89% probability of an outright December interest rate hike.
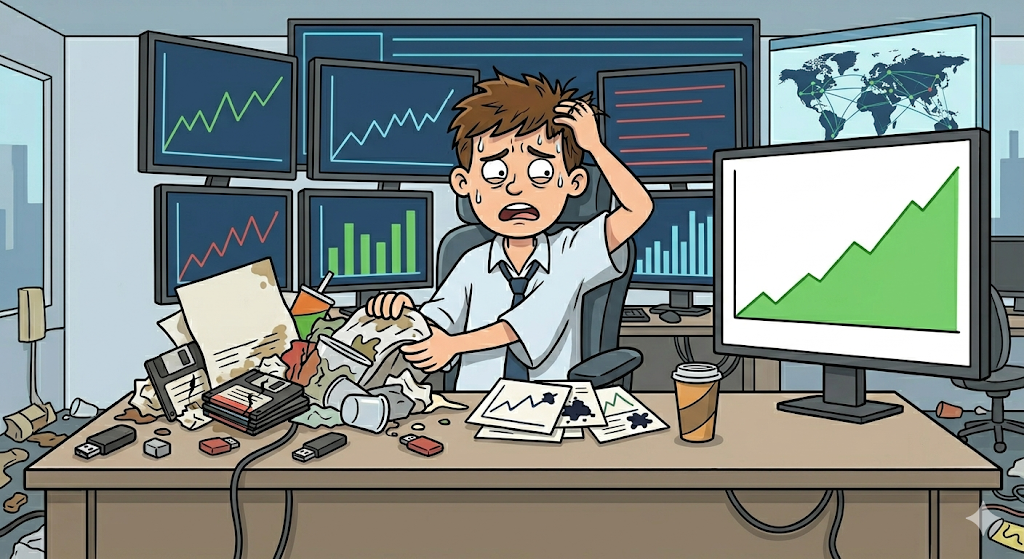
🚀 SpaceX stock drops again after rally following blockbuster IPO
SpaceX (SPCX) shares stabilized and trended modestly higher during Monday's global asset reshuffle, recovering effectively from an end-of-week cooling block. The record-shattering $75 billion public vehicle continues to dominate institutional fund flows, though analysts note the aggressive liquidity squeeze that recently battered proxy tech names is beginning to ease as passive funds wrap up their strategic capital reallocations.
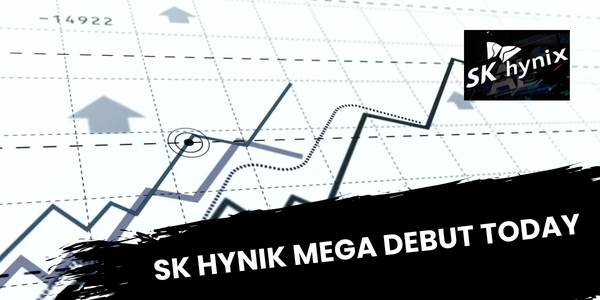
💻 SK Hynix Overtakes Samsung to Become South Korea’s Most Valuable Listed Entity
In a historic restructuring of South Korea's technology landscape, SK Hynix jumped 5.7% to achieve a staggering 2,082 trillion won ($1.35 trillion) market capitalization, officially dethroning Samsung Electronics as the nation's most valuable listed corporation.
📉 WiseTech Global Tumbles on Reports of Pending Founder Investigation
Shares of Australian logistics and application software giant WiseTech Global (WTC) crashed heavily on the ASX exchange during Monday's opening session. The aggressive selloff was triggered by breaking news reports stating that federal police authorities have officially initiated a formal investigation into the company's billionaire founder and chief executive, Richard White, sparking immediate corporate governance anxieties among institutional stakeholders.
📊 U.S. Index Futures Hover Near Flatline as Traders Weigh Iran Deal Progress
U.S. equity futures were little changed Monday morning as Wall Street assessed the latest developments in the Iran war negotiations and awaited closely watched Federal Reserve inflation metrics. S&P 500 futures traded down 0.2% while Nasdaq-100 contracts hovered just below the flatline, alongside futures tied to the Dow Jones Industrial Average which slipped 29 points or 0.1%.

Bad Data Creates Good-Looking Lies
Your backtest looks incredible.
The win rate is high. The drawdowns are small. The equity curve keeps climbing.
Then you trade it live… and everything changes.
That’s often a data problem, not a strategy problem.
Missing prices, incorrect timestamps, survivorship bias, and unrealistic assumptions can make a weak strategy look strong. One of the biggest traps is lookahead bias — using information in your test that wouldn’t have been available at the time of the trade.
The results look perfect because the strategy is accidentally using the future.
Strong traders question their data before they trust their results. They check assumptions. They test with realistic conditions. They understand that clean backtests matter less than honest ones.
Because a strategy is only as good as the data behind it.
When you respect data quality, your expectations become more realistic. You build systems that can survive outside the spreadsheet.
Reliable inputs create reliable decisions.
Some traders like exploring how data, testing, and market structure shape real trading performance.
If that’s you, you can explore a few market reads here:

Pennant
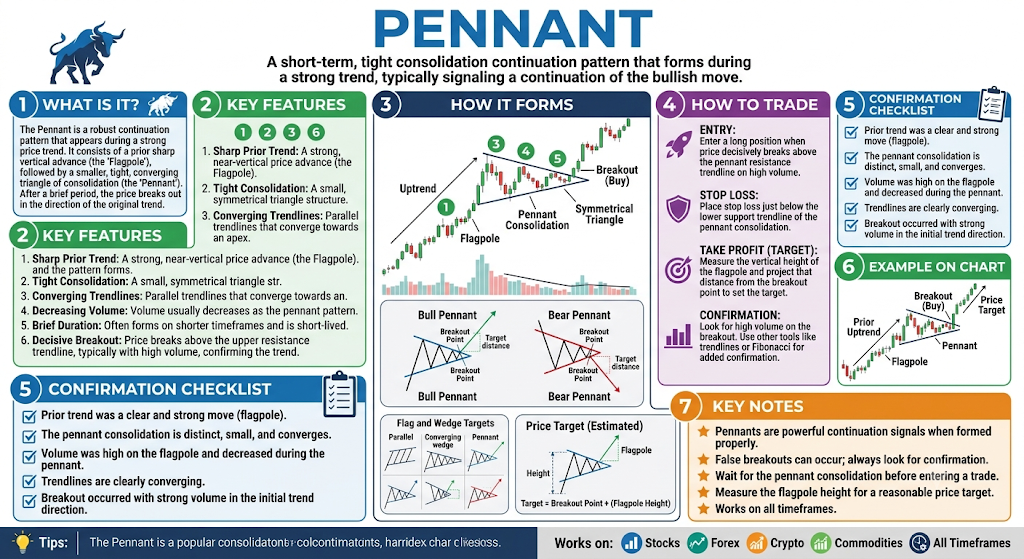
The Pennant is a short-term continuation pattern that looks very similar to a Flag, but instead of forming a parallel channel, the pause forms a tiny, symmetrical triangle. It occurs when a massive, vertical price blast (the flagpole) enters a brief, tight squeeze where the highs get lower and the lows get higher. It signals that the market is coiling its energy for another major explosion in the same direction.
🔴 The Red Zone (The Flagpole)
The Meaning: Price shoots straight up or straight down in a violent, near-vertical run. This represents heavy, aggressive momentum where one side dominates completely. The Move: Do not jump in here. Chasing a vertical pole leaves you highly exposed to a sudden pullback when the initial rush cools down.
🟡 The Yellow Zone (The Pennant Squeeze)
The Meaning: The price action suddenly stalls and begins to bounce back and forth inside a tiny, narrowing triangle. The waves get smaller and smaller. The Move: Watch closely. This is the "pennant" taking shape. Buyers and sellers are locked in a brief, tight deadlock. Because the space is shrinking, the market is packing massive energy into a tight corner like a compressed spring.
🟢 The Green Zone (The Breakout)
The Meaning: The price violently snaps out of the narrow tip of the triangle, clearing the sloping boundary line in the direction of the original flagpole. The Move: Go! A clean break out of the pennant lines is your official trigger to enter. It proves the deadlock has broken and the primary trend is rushing forward again.
🔍 Two Simple Signals to Watch
1. The Shrinking Volume
Keep a close eye on the volume bars during the yellow zone deadlock.
- The Logic: In a healthy Pennant, trading volume should steadily dry up and hit a low point right as the price reaches the tip of the triangle. This shows the market is resting. When the green light breakout happens, volume must instantly spike to confirm the move is real.
2. The Premature Break
Watch where the price decides to break out of the triangle.
- The Logic: The most powerful breakouts happen when the price snaps out between two-thirds and three-quarters of the way through the triangle. If the price drifts all the way to the absolute peak point without popping, the pattern loses its tension and often turns into a messy, flat crawl.
💡 The Simple Secret
Think of a Pennant as a pressure cooker. The flagpole pours all the heat into the pot, and the triangle lid seals it tight until the pressure builds to a maximum. To find your target area, measure the height of the original flagpole—the price will very often mirror that exact same vertical distance on the next leg up after breaking out of the pennant.

Maybe Your Strategy Is Complicated Because You're Still Confused
At some point, many traders fall in love with complexity.
The chart starts simple enough.
Then you add market structure.
Then volume analysis.
Then order blocks.
Then liquidity concepts.
Then a custom indicator.
Then a dashboard.
Then a higher-timeframe filter.
Then another filter to confirm the filter.
Eventually, explaining your setup takes longer than the trade itself.
And if someone asks, "So why did you take that entry?"
You need fifteen minutes, three screenshots, and a laser pointer.
Here's the uncomfortable possibility:
Maybe the strategy isn't sophisticated.
Maybe it's camouflage.
Because complexity can make us feel intelligent.
It gives us something to work on, tweak, and optimize.
It creates the comforting illusion that if we just add one more layer, one more confirmation, one more condition, trading will finally become predictable.
But sometimes, complexity is just uncertainty dressed up in expensive clothing.
I've seen traders who couldn't explain their own strategy in plain English.
Ask them what constitutes a valid setup, and you'll get a dissertation.
Ask them what invalidates the setup, and suddenly there are exceptions, caveats, and "market context."
That's usually a sign that the trader doesn't trust the process yet.
And that's okay.
Most of us go through that phase.
The problem comes when complexity becomes a hiding place.
Because a complicated strategy gives you an excuse for almost anything.
Missed a trade?
"The confluence wasn't fully aligned."
Lost money?
"There was hidden liquidity."
Skipped your best setup?
"The order flow wasn't ideal."
The strategy becomes so flexible that it's impossible to know whether you're following it or simply interpreting it based on how you feel that day.
Ironically, many experienced traders eventually move in the opposite direction.
Not because markets are simple.
Markets are messy.
But they've learned that their execution doesn't have to be.
They've done enough work to recognize what truly matters and what merely makes them feel busy.
A good exercise is this:
Try explaining your strategy to someone who knows nothing about trading.
Can you describe your edge in three sentences?
Can you tell them exactly why you'd enter, where you'd exit, and when you'd stay out?
If not, don't panic.
It doesn't necessarily mean your strategy is bad.
But it may mean you're still building understanding, and complexity has been helping you avoid admitting that.
And that's not a weakness.
It's just part of the journey.
The goal isn't to have the most sophisticated system in your trading group.
The goal is to have a process so clear that when opportunity appears, you don't need to think harder.
You simply recognize it.
And there is something wonderfully freeing about reaching the point where your charts start looking less impressive...
...but your decisions start becoming much better.