Spacex IPO Sparks $250B Rush
....................................................................................................................


Good Morning,
We’re starting Wednesday in the red as the geopolitical backdrop takes a massive turn for the worse. Futures are sliding across the board, with Nasdaq futures down 0.6% and the S&P 500 dropping 0.4%. The brief optimism of a ceasefire has vanished, replaced by active military engagement and fears of a fresh inflation spike.
The U.S. and Iran are trading direct military strikes. Following the downing of a U.S. Apache helicopter on Monday, President Trump promised a retaliatory response, and he delivered. U.S. Central Command confirmed "self-defense" airstrikes hitting Iranian air defenses and radar sites. Bloomberg reported at least six major explosions rocking Qeshm Island in the critical Strait of Hormuz. With the shipping lane effectively locked down, energy supply fears are rushing back into the market.
The CPI inflation data is dropping at a terrible time. At 8:30 a.m. ET, the government releases May's Consumer Price Index, and economists are bracing for a jump to 4.2% year-over-year. Because the war is driving up fuel and shipping costs, investors are terrified that inflation is becoming completely unmanageable. If the numbers come in hot, it strengthens the case for Kevin Warsh's Fed to actually raise interest rates later this year.
AI cloud infrastructure faces an evening test. After the closing bell, Oracle (ORCL) reports earnings. Because their cloud business counts massive players like OpenAI as customers, Wall Street will treat this report as a vital health check for the AI trade, especially since investors have been rotating out of tech and into defensive stocks over the last 48 hours.
It's a high-stakes Wednesday. Between actual rocket fire in the Gulf, a looming inflation print, and the countdown to SpaceX's historic IPO this Friday, the market's record-high cushion is being severely tested.

📉 Nasdaq and S&P 500 Pull Back as Renewed Iran Clashes Test Truce
U.S. stock indexes fell on Tuesday as an intraday technology rebound fizzled and fresh geopolitical anxieties rattled investors. Market confidence took a hit after President Donald Trump confirmed on social media that Iran had shot down a U.S. Apache helicopter patrolling the Strait of Hormuz overnight, vowing a direct military response and clouding hopes for a Middle East ceasefire.
🛢 Oil Choppy after U.S. Launches Retaliatory Strikes Along Iranian Coast
Energy markets experienced highly volatile trading on Wednesday after the U.S. military successfully completed targeted strikes against Iranian forces near the Strait of Hormuz. International benchmark Brent crude slid slightly to $91.27 a barrel, while U.S. crude settled at $88.03, paring an initial 1% spike as traders balanced immediate supply disruptions against the swift conclusion of the defensive operation.
🥇 Gold Slumps Below $4,200 as Gulf Explosions Fuel Inflationary Fears
Bullion extended its steep down-leg, collapsing 2.1% to trade around $4,173 an ounce on Wednesday following reported explosions on Qeshm Island and Iran’s southern coast. Despite escalating military conflict typically acting as a safe-haven catalyst for precious metals, the threat of an elongated war is pushing macro desks to price in persistent inflation and higher-for-longer interest rates.
📉 Tech Sells Off as "Parabolic 7" Chip Giants Hit a Major Valuation Wall
The Nasdaq Composite printed a wild, V-shaped intraday chart, plunging 4% before clawing back to close down 1% as traders aggressively dumped high-beta technology leaders. Chip designers like Marvell fell 10% on the day alongside high-flying software names, signaling a broader valuation exhaustion as capital increasingly shifts into defensive consumer staples.
🌏 SoftBank Sinks 8% as Stretched AI Valuations Drag Down Asian Tech Hubs
Semiconductor and hardware players across the Asia-Pacific region resumed their slide on Wednesday, tracking the volatile overnight tech rotation on Wall Street. SoftBank Group tumbled more than 8% in Tokyo trading, spearheading regional losses across electronics mainstays like Samsung and SK Hynix as investors fret over overextended artificial intelligence equipment valuations.
🚀 SpaceX IPO Nears 4x Oversubscription, Triggering Global Tech Liquidity Squeeze
Elon Musk’s SpaceX is triggering a classic pre-mega-IPO liquidity squeeze across digital assets and existing equities as institutional funds hoard cash ahead of the June 12 listing. The $75 billion public offering has drawn a staggering $250 billion in institutional demand, leaving the historic primary raise heavily oversubscribed ahead of its final Thursday pricing.
🖥️ Super Micro Plunges 9% on Dilutive $7B Equity Capital Raising Plan
Super Micro Computer (SMCI) shares tumbled in extended trading after management unveiled a massive $7 billion equity financing package to bankroll manufacturing component purchases. While the company highlighted a jaw-dropping $39 billion backlog of new AI server orders, Wall Street focused directly on the massive near-term shareholder dilution risk.

Your Broker Isn’t Limiting You. It’s Limiting Your Risk.
Many traders see leverage restrictions and immediately get frustrated.
They want bigger positions. Bigger opportunities. Bigger profits.
So when a broker or regulator limits leverage, it feels like a barrier.
But there’s another way to look at it.
Leverage is one of the few tools that can grow an account quickly—or damage it just as fast. The higher the leverage, the smaller the mistake needed to cause a large loss.
That’s why different countries have different rules.
The restriction isn’t really about stopping traders from making money. It’s about reducing the damage that can happen when risk gets out of control.
Strong traders understand this. They don't rely on extreme leverage to make a strategy work. They focus on consistency, position sizing, and risk management.
Because if a trade only works with excessive leverage, the problem may not be the restriction.
It may be the strategy.
When you stop chasing leverage, you start paying more attention to execution. And execution is what keeps traders in the game long enough to grow.
Some traders like exploring how trading rules, market structure, and risk management shape long-term performance.
If that’s you, you can explore a few market reads here:

Stochastic Oscillator
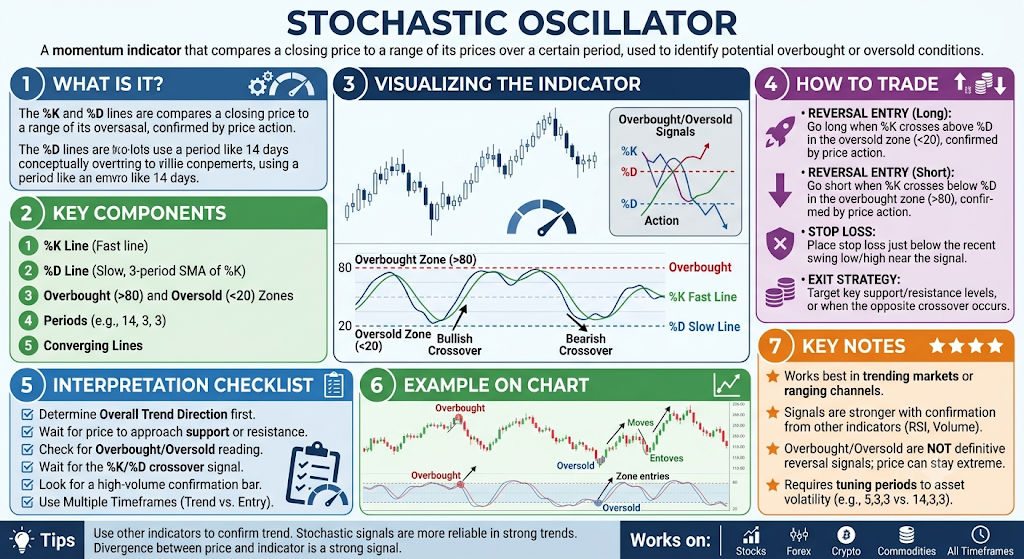
The Stochastic Oscillator is a momentum tracker that acts like a "Closing Speedometer." It measures where an asset's price closes compared to its high and low trading range over a set period of time (usually 14 days). It moves on a scale of 0 to 100 to show you if the price is closing near the top of its recent boundary or the bottom.
🔴 The Red Zone (Above 80)
The Meaning: The price is consistently closing right at the absolute top of its recent trading range. The market is "Overbought," meaning buyers have driven the asset into an expensive, highly aggressive territory. The Move: Caution. The buyers are maxed out. While the price can ride high for a bit, this is an alert zone where a downward turn is brewing.
🟡 The Yellow Zone (20 to 80)
The Meaning: The price is closing comfortably within the middle of its recent boundaries. This is the neutral highway where momentum is steady and stable. The Move: Hold. The market is in a normal flow. There is no extreme hype or extreme panic to react to yet.
🟢 The Green Zone (Below 20)
The Meaning: The price is consistently closing at the absolute bottom of its recent trading range. The market is "Oversold," meaning panic sellers have slammed the asset into a cheap, heavily discounted territory. The Move: Get ready. The selling pressure is hitting a brick wall. This is the prime zone where the asset runs out of room to drop, and a sharp upward bounce usually triggers.
🔍 Two Simple Signals to Watch
1. The Line Cross (The Hook)
The indicator uses two lines: the fast line (usually called %K) and a slow moving average line (called %D).
- The Logic: Don't buy or sell the exact moment the lines enter the Red or Green zones—wait for them to cross and exit. A Buy Signal is confirmed when both lines drop below 20, cross over each other, and hook back above 20. A Sell Signal happens when they rise above 80, cross, and hook back below 80.
2. Extreme Stalling
Sometimes in an incredibly powerful, raging trend, the Stochastic lines will flatten out and weld themselves to the absolute top (100) or absolute bottom (0) of the box.
- The Logic: If the lines freeze at 100, it means the buyers are so dominant that the price is closing at the exact high of the day, day after day. Do not try to fight this or short it until the lines clearly break away from the ceiling.
💡 The Simple Secret
Think of the Stochastic Oscillator as a pendulum. When you swing a pendulum, it slows down right before it changes direction. The Stochastic indicator catches that exact moment when the price closes slightly away from its recent high or low, giving you an early warning that the swing is reversing before it even shows up clearly on a standard price chart.

You Knew the News Was Coming
The setup looked good.
Trade was moving fine.
Maybe slightly in profit.
Maybe hovering around entry.
Then you glanced at the economic calendar and saw it:
High-impact news in 15 minutes ⚠️
CPI.
NFP.
FOMC.
One of those events that can turn a calm chart into absolute violence in seconds.
And deep down?
You knew you probably shouldn’t be holding full size through it.
But instead of reducing risk or stepping aside… you stayed in.
Then came the internal speech every trader has given themselves at some point:
“I still believe in the setup.”
“I’m convicted.”
“It’ll probably spike in my direction.”
Sounds strong.
Sounds confident.
But sometimes?
That’s not conviction.
That’s attachment wearing a motivational quote disguise 😂
Because real conviction still respects uncertainty.
The market does not care how beautiful your setup looked before a major news release.
One number can erase technical structure instantly.
Liquidity disappears.Spreads explode.Price teleports.
And suddenly your “controlled trade” becomes survival mode.
The dangerous part is that traders often confuse risk-taking with bravery.
Holding through major news FEELS bold.
But bold and intelligent are not always the same thing.
A lot of the time, traders stay in because they emotionally cannot tolerate:
- missing the move
- closing too early
- being wrong after re-entering later
So they gamble with uncertainty and label it confidence.
Professional traders treat scheduled news differently.
Not emotionally.
Practically.
They ask:
- Does this event fit my plan?
- Is the volatility worth the risk?
- Am I being paid enough for this uncertainty?
And most importantly:“Would I willingly ENTER this position right before the event?”
That question exposes everything.
Because many traders wouldn’t open a new trade before major news…
…but they’ll stubbornly HOLD an existing one through it just to avoid making a disciplined decision.
That’s not strategy.
That’s emotional inertia.
And honestly?
Some traders spend hours doing careful technical analysis… only to casually hand the outcome over to a random economic number released by someone in a suit at 8:30AM
So here’s the mindset shift:
You do not have to participate in every explosive moment to be a good trader.
Sometimes the smartest trade around major news…
…is respecting the uncertainty enough to survive it.