SK Hynix Seeks $28B US IPO
....................................................................................................................


Good morning,
Tech stocks are staging a roaring comeback to kick off the new week, giving Wall Street a nice dose of relief after the long holiday weekend.
We’re opening Monday morning with green across the board as investors shake off the pre-holiday blues. Nasdaq futures are leading the charge, jumping 1%, while the S&P 500 is up 0.4% and the Dow is gaining a steady 0.2%. After a long Fourth of July break, the intense selling pressure that pounded the microchip and AI sectors last week is finally easing up.
The Dow is sitting pretty at record highs. This morning's steady rise follows a historic, though holiday-shortened, week for the blue-chip benchmark. Last Thursday, a softer-than-expected jobs report convinced investors that the economy is cooling down just enough to keep the Federal Reserve from getting overly aggressive with interest rates. That data sent the Dow flying to an all-time record close, and today's action shows the bulls aren't quite ready to pack it in.
Investors are bracing for a fresh wave of economic clues. While tech shares are enjoying a much-needed bounce this morning, the market is keeping its seatbelt fastened. Wall Street is waiting on a fresh round of economic reports dropping later this week. These numbers will give us a clearer look at the true health of the economy and help settle the ongoing debate over whether the Fed's next major move will be a rate cut or a rate hike.
It's a highly optimistic, tech-driven Monday. The holiday hangover is gone, the chip sector is bleeding less, and investors are eager to build on last week's historic momentum.

📊 U.S. Futures and European Stocks Rise as Oil Supply Relief Eases Inflation Fears
European indices and Wall Street futures advanced on Monday morning following the U.S. holiday break, with the pan-European STOXX 600 rising 0.2% and S&P 500 futures gaining 0.5%. Risk appetite found immediate support as an expanding energy supply outlook pulled down global crude benchmarks, offering much-needed relief from structural inflation pressures ahead of a highly anticipated corporate earnings season.
💻 SK Hynix Capitalizes on AI Boom with Blockbuster $28B Nasdaq Listing
South Korean memory giant SK Hynix is officially launching a massive $28 billion U.S. depository receipt listing on the Nasdaq on Monday, marking one of the largest corporate share sales in global history. According to regulatory filings, the hardware titan will issue 17.79 million new shares structured as American Depository Receipts (ADRs) to directly capture the global artificial intelligence infrastructure buildout.
📈 Wall Street Backs Sustained Bull Market Momentum for Second Half of 2026
Investment strategists are doubling down on equity upside for the remainder of the year, citing strong second-quarter performance and resilient macro data. Analysts point out that falling crude and retail gasoline prices—following the de-escalation of the U.S.-Iran conflict—are providing a powerful structural tailwind to corporate bottom lines, keeping the broader S&P 500 and Nasdaq Composite firmly in a primary bull cycle.
🛢️ Oil Slides on Growing Supply Glut Concerns as OPEC+ Output Expansion Looms
Crude prices faced steady downward pressure on Monday as commercial energy flows through the critical Strait of Hormuz persisted without severe operational delays. The price retreat was further accelerated by formal policy signals from OPEC+ indicating a structural push toward increased global production, fueling investor concerns over a potential near-term supply surplus.
🌏 Asian Markets Firm Up as Reopened Strait of Hormuz Logistical Transits Build
Exchanges across Asia-Pacific closed mostly higher to start the trading week, tracking positive momentum from global index futures. While formal U.S.-Iran diplomatic tracks remain complex, maritime transport networks reported that 160 commercial vessels successfully transited the Strait of Hormuz from Monday to Saturday of last week, drastically lowering localized geopolitical risk premiums.
🤖 Bulls Look to Samsung's Earnings Report to Defuse Stretched AI Valuation Jitters
Following weeks of high-beta volatility across the global technology ecosystem, semiconductor investors are heavily counting on Samsung Electronics' upcoming Tuesday financial release to serve as a critical stabilization anchor. Institutional desks are seeking concrete evidence of sustained data center equipment spend to justify lofty hardware trading multiples and validate the next leg of the AI trade.
₿ Binance Outflows Rocket to $1.2B as Weekly Ethereum Withdrawals Hit Three-Year High
Binance registered a massive 207% weekly surge in net capital flight, with total platform outflows climbing to $1.23 billion. The aggressive liquidity draw from the major centralized crypto exchange was primarily spearheaded by decentralized network players, pushing individual Ethereum withdrawals to their highest absolute velocity in three years.

Too Many Tools Can Slow You Down
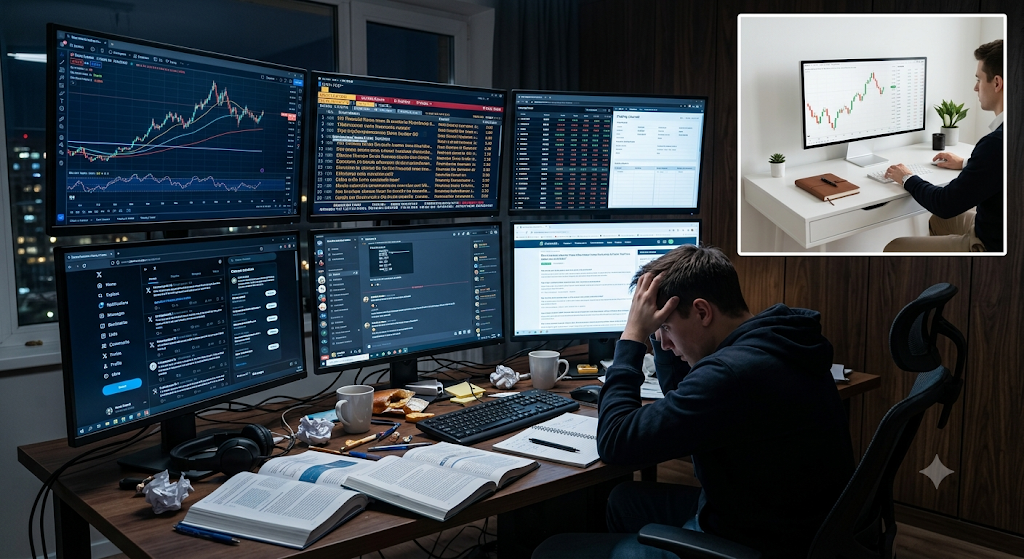
One app for charts.
Another for news.
A different one for your watchlist. Another for journaling. Then Discord, X, Telegram, and five browser tabs open at the same time.
It feels like you're building the perfect trading setup.
But you're really building distractions.
Switching between too many tools breaks your focus. Important information gets buried. Simple decisions become complicated because you're constantly chasing the next notification or indicator.
More tools don't automatically make you a better trader.
Strong traders keep their workflow simple. They know where to find the information they need, and they ignore everything else. Their setup helps them make decisions—not delays them.
Because every extra tool adds another chance to lose focus.
When your workflow is simple, your thinking becomes simpler too. You spend less time managing apps and more time managing trades.
The best trading setup isn't the one with the most tools.
It's the one that helps you make better decisions.
Some of the best trading ideas come from simplifying, not adding more. If you enjoy discovering thoughtful market perspectives, you can explore a few market newsletters here:
Explore a few market newsletters here:

Descending Triangle
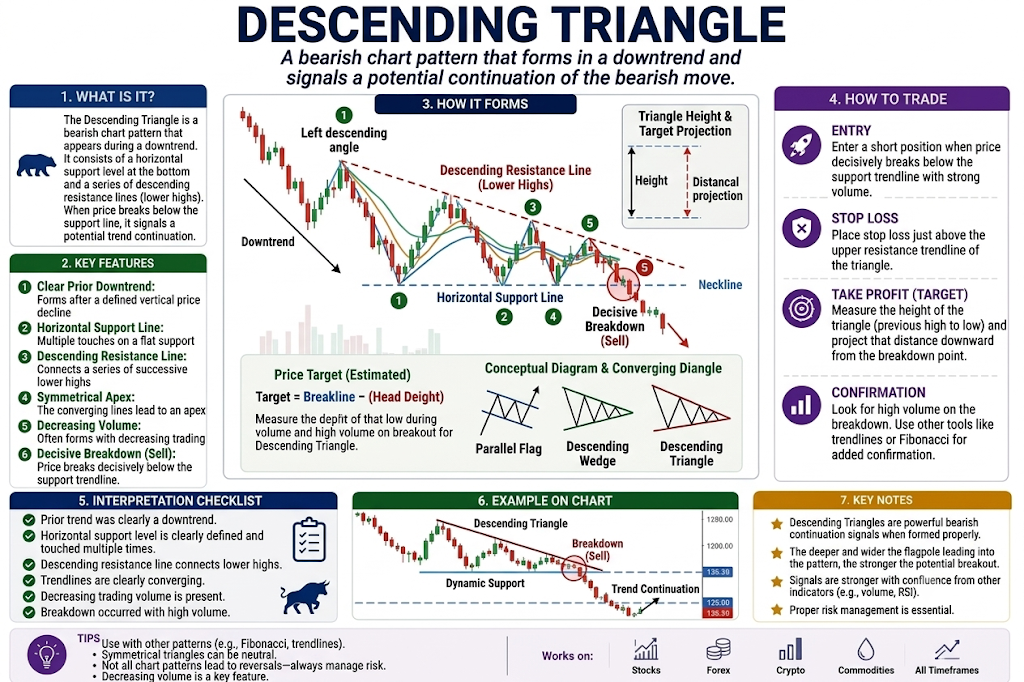
The Descending Triangle is a bearish chart pattern that is the exact mirror image of the Ascending Triangle. It looks like a right-angled triangle pointing downward. It forms when the price keeps hitting a flat, horizontal floor of support at the bottom, while the rallies get weaker and weaker, forming a falling line of lower highs. It signals that sellers are becoming increasingly aggressive, pinning the buyers against a wall until the floor snaps.
🔴 The Red Zone (The Falling Ceiling Line)
The Meaning: This is the top sloping boundary line connecting the lower highs. Every time the price attempts to rally, the sellers step in earlier and earlier to shut down the bounce.
The Move: Do not buy. The market is firmly trapped under a descending ceiling, proving that supply is steadily overwhelming demand.
🟡 The Yellow Zone (The Flat Horizontal Floor)
The Meaning: The price repeatedly drops to a specific price level where a wall of buyers is currently holding the line, creating a flat bottom floor.
The Move: Watch closely. Even though the floor is holding, the fact that the bounces off it are getting smaller means the buyers are running out of cash. The market is getting tightly compressed into a corner, getting ready to burst.
🟢 The Green Zone (The Horizontal Breakdown)
The Meaning: The price finally accumulates enough downward pressure to smash straight through the flat horizontal floor, destroying the support wall.
The Move: Go! A clean close below the flat horizontal floor line is your official confirmation signal to exit long positions or enter a short trade. The buyers have completely run out of bullets.
🔍 Two Simple Signals to Watch
1. The Volume Pattern
Keep a close eye on the volume bars as the price grinds into the narrow point of the triangle.
- The Logic: Volume should steadily shrink as the price gets squeezed, showing a temporary standoff. Crucially, when the price finally breaks downward through the flat floor, a large surge in volume is required to prove that major institutional players are actively dumping the asset.
2. The Flat Floor Test
Watch how the price behaves each time it hits the horizontal floor.
- The Logic: If the price lands on the floor and barely bounces at all before grinding sideways right against it, the floor is highly vulnerable. A lack of a bounce shows that there are no aggressive buyers left—only a passive wall that is about to get run over.
💡 The Simple Secret
Think of the Descending Triangle as a bouncing ball trapped under a sloping roof. Each time the ball hits the floor, it can't bounce as high because the roof keeps forcing it down, until it loses all its energy and crashes straight through the floorboards. To estimate how far the price will drop after the breakout, measure the vertical height of the triangle at its widest point—the price will very often drop that exact same distance downward once it clears the breakout line.

You Fell in Love With the Story
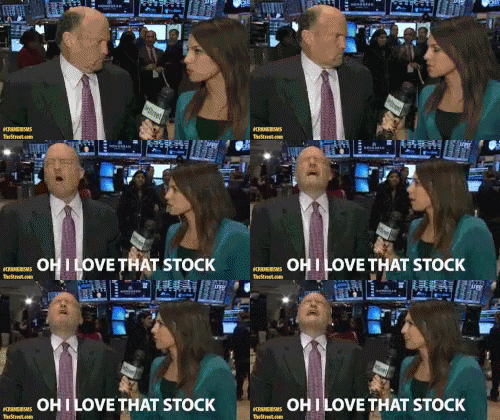
Every trader loves a good market story.
"The economy is slowing."
"The Fed has to cut rates."
"Oil is going higher because of geopolitics."
"AI is the future."
The best part?
Sometimes those stories are absolutely right.
The problem is... the market doesn't move because a story makes sense.
It moves because of buyers and sellers.
And sometimes they completely ignore the story you've spent three weeks believing.
That's where traders get trapped.
The chart starts sending warning signs.
Higher lows begin breaking.
Momentum fades.
Volume dries up.
Maybe price even closes below a level you promised yourself you'd respect.
But instead of listening to what the market is saying, you start defending the narrative.
"The market just hasn't realized it yet."
"Eventually it'll catch up."
"This is just short-term noise."
Notice what's happened?
You're no longer analyzing the market.
You're arguing with it.
I've seen traders hold onto losing positions for weeks, not because the chart looked good, but because the story still made sense in their head.
They became economists.
The market needed traders.
There's an important distinction.
A narrative should help you form ideas.
It should never become stronger than the evidence in front of you.
Think about a weather forecast.
It might say there's an 80% chance of sunshine.
But if you walk outside and it's pouring rain, you don't argue with the sky.
You grab an umbrella.
Yet traders do this all the time.
The chart is raining.
They're still dressed for summer.
One question has saved me from countless bad decisions over the years:
"If I had never heard the story... would I still take this trade based on the chart alone?"
Sit with that for a moment.
It's amazing how often the answer changes.
That's why experienced traders stay flexible.
They can have a strong opinion...
...without becoming emotionally attached to it.
Because they know something every market eventually teaches:
Price is the final vote.
Not headlines.
Not forecasts.
Not your favorite macro thread.
The market doesn't reward the trader with the smartest explanation.
It rewards the trader who's willing to admit, "My story was wrong," before the loss becomes a lesson they didn't need to pay for.
There's no shame in changing your mind.
In fact, in trading, it might be one of the most profitable skills you'll ever develop.