Shein Targets $40B IPO
....................................................................................................................



Good morning!
The stock market is doing something funny right now: it’s turning weak economic news into a reason to celebrate, all while brushing off major drama in the Middle East.
After finishing its best week since April and pushing the S&P 500 to a brand-new record high, the market is edging up again. Why are investors so happy? Blame it on Friday's weak jobs report. Usually, a slowdown in hiring makes people nervous. But right now, Wall Street sees bad job news as great news for interest rates. Investors immediately bet that a weaker workforce means the Federal Reserve won't need to raise interest rates next month, giving stocks room to keep climbing.
Still, there’s a big, messy wild card lurking in the background: the Strait of Hormuz. Hopes for a quick deal to reopen the world's most important oil shipping route hit a wall over the weekend. Iran is talking with Oman, but it's telling the U.S. it won't negotiate directly until its demands are met. Meanwhile, President Trump made it clear the U.S. is keeping the pressure on. Because of that back-and-forth, oil prices ticked right back up.
This sets up a simple showdown for the rest of the week. Wall Street is betting that the hope of lower interest rates is strong enough to beat out the risk of rising oil prices. But that confidence will face a real test when brand-new inflation numbers drop over the next couple of days.
If inflation keeps cooling down alongside the job market, this stock rally might actually keep going. But if prices come in hot, everyone who cheered Friday's weak job numbers might realize they celebrated way too early.

🌍 Global Stocks Tick Up as Hormuz Deal Hopes Keep Oil Steady
Global equities inched higher on Monday, with Europe's Stoxx 600 up 0.1% and S&P 500 futures gaining 0.2%. Oil held flat after Tehran indicated it is finalizing a shipping transit pact with Oman, though it reiterated that the Strait of Hormuz will only reopen once the U.S. meets specific conditions.
📊 S&P 500 Reclaims Record Highs After Jobs Surprise Shifts Rate Bets
Wall Street closed out Friday on a high note, sending the S&P 500 up 0.6% back into record territory. A softer-than-expected July jobs report led traders to recalibrate Fed interest rate expectations, while easing capital expenditure anxieties provided fresh fuel for technology equities.
🛍️ Shein Valued at $22B–$25B Ahead of Highly Anticipated IPO
Bloomberg Intelligence issued a fresh valuation marker for fast-fashion retailer Shein, pegging its enterprise worth at $22 billion to $25 billion. The estimate reflects normalized 2027 earnings expectations as the e-commerce giant prepares for one of the year's largest public listings amid trade and tariff headwinds.
📈 S&P 500 Futures Rise as Markets Await Inflation Data
U.S. stock index futures pushed higher on Monday morning, with S&P 500 futures adding 0.16% and Nasdaq-100 futures gaining 0.46%. Market participants are treading cautiously ahead of Wednesday's critical CPI report while tracking complex diplomatic talks around the Strait of Hormuz.
🛢️Oil Steady as Iran Tempers Hopes for Rapid Hormuz Reopening
Crude benchmarks were little changed on Monday, with Brent holding near $83.74 a barrel and WTI at $78.21. Near-term price movement remains capped as market optimism over a regional transit deal is balanced against Iran's firm insistence on its diplomatic demands before restoring shipping access.
🌏 Asian Shares Track Wall Street Rally Led by 2.1% Nikkei Jump
Bourses across Asia-Pacific opened the week higher, spearheaded by a 2.1% surge in Japan's Nikkei 225 to 66,970.22. Technology hardware suppliers led the charge, with semiconductor equipment makers Tokyo Electron leaping 4.1% and Advantest climbing 6.4%.
🥇 Gold Reclaims 50-Day Moving Average in Biggest Weekly Gain Since Feb
Spot gold posted a nearly 7% weekly surge, breaking out of a multi-month downtrend to reclaim its 50-day moving average. The technical breakout was anchored by a 4% single-day jump on Wednesday, driving gold futures to a seven-week peak as macro investors re-enter the trade.

Your Backtest May Be Ignoring the Strategies That Failed
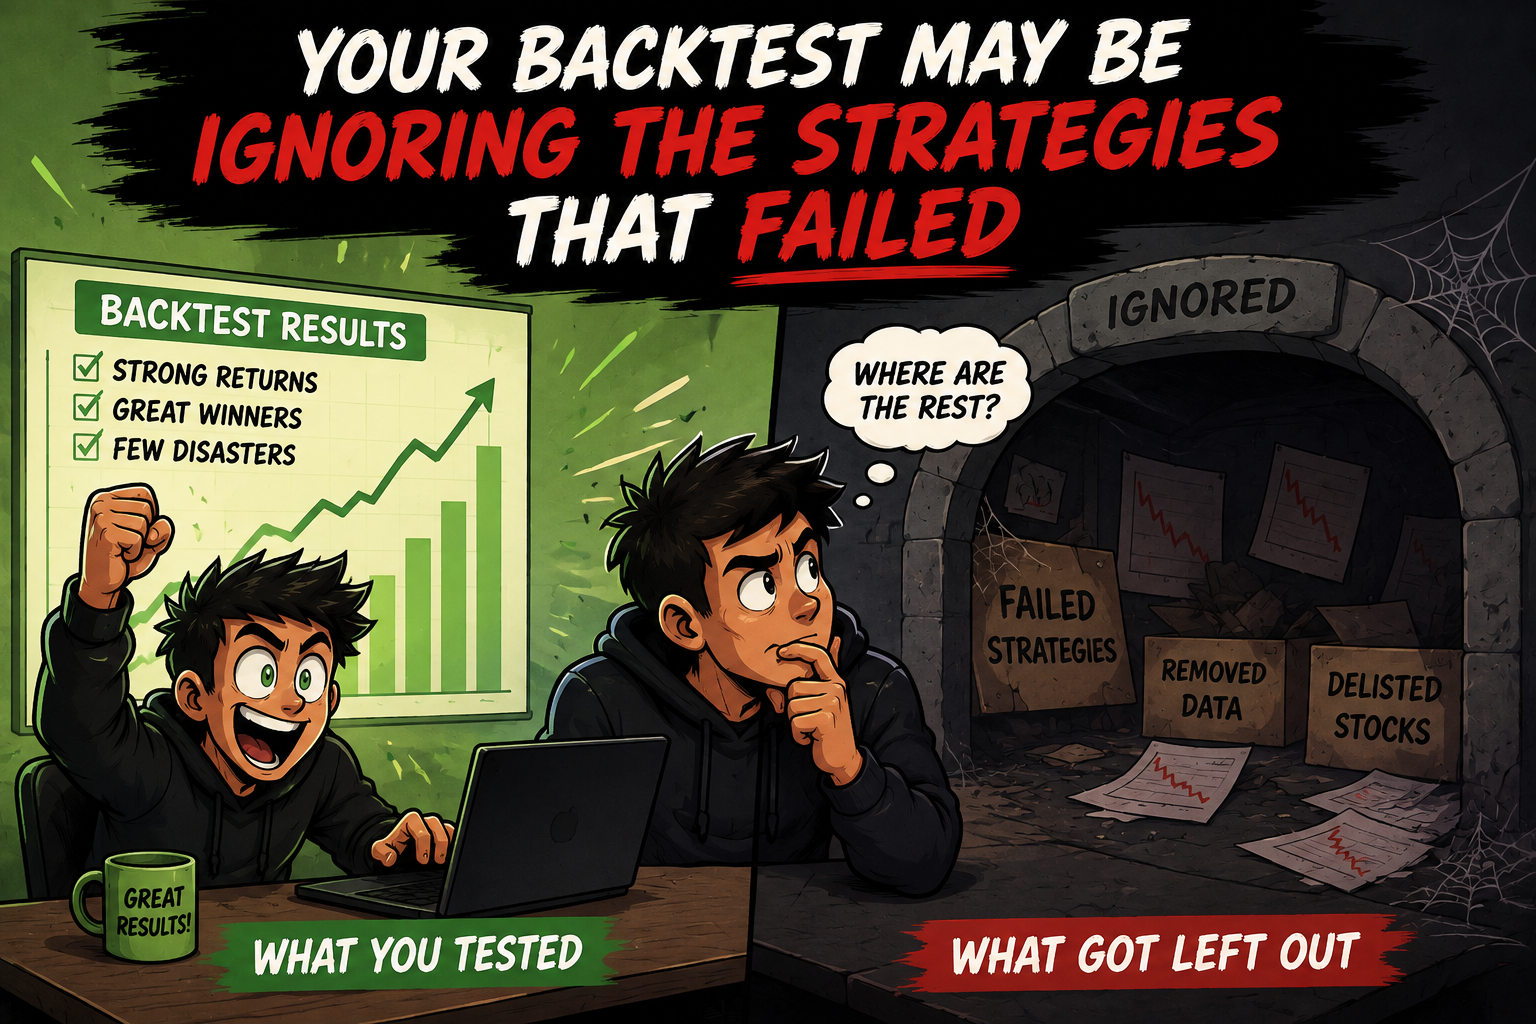
You test a strategy on a list of successful stocks.
The results look impressive.
Strong returns. Great winners. Few disasters.
So you assume you've found an edge.
But what happened to everything that didn't survive?
That's survivorship bias.
When traders research only stocks, funds, or strategies that exist today, they can accidentally remove the failures from the sample. The companies that went bankrupt, disappeared, or were delisted aren't there to remind you how many things went wrong.
That can make the past look much better than it really was.
Strong traders understand that good research includes the losers too. They don't just study what survived. They ask what disappeared, why it disappeared, and whether those failures would have changed the results of their strategy.
Because a strategy shouldn't be judged only by the winners that made it through.
When you include the full picture, your backtests become more honest. The returns may look less impressive, but the conclusions become more useful.
A realistic backtest is better than a beautiful one.
Good trading research isn't about finding results that look impressive. It's about finding information you can actually trust.
If you'd like to explore more thoughtful market perspectives, you can discover a few market newsletters here:

Diamond Bottom
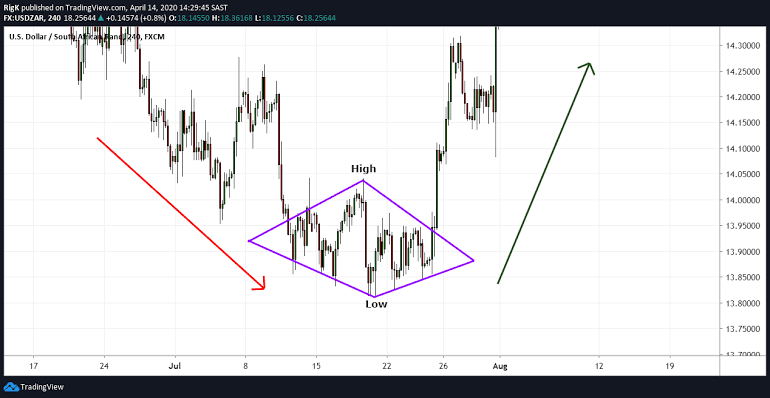
Diamond Bottom Reversal and Breakout Structure. Source: How the Market Works
The Diamond Bottom is a rare, powerful bullish reversal chart pattern that forms at the base of an extended downtrend. It looks like a Broadening Pattern (widening price swings) merged directly into a Symmetrical Triangle (narrowing price swings). It signals that selling momentum is fracturing—moving from erratic panic swings into a tight squeeze right before buyers take total control.
🔴 The Red Zone (The Left Broadening Expansion)
The Meaning: The price makes aggressive lower lows and higher highs. Panic selling and early bottom-fishing fight for control, spreading the price boundary outward like a Megaphone pattern. The Move: Exercise caution. The market is extremely unstable. Avoid jumping into long positions here, as the expanding price swings show that sellers still have enough force to push fresh low points.
🟡 The Yellow Zone (The Right Symmetrical Squeeze)
The Meaning: After hitting its lowest trough in the center of the diamond, volatility flips. Price swings contract into higher lows and lower highs, coiling tightly into a triangle. The Move: Watch closely. Panic selling has dried up. The tight consolidation shows that bears are no longer able to drive the price down, and explosive breakout energy is storing up inside the right corner of the diamond.
🟢 The Green Zone (The Upper Resistance Breakout)
The Meaning: The price rallies to the upper-right downward-sloping resistance line of the diamond and breaks cleanly through it. The Move: Go! A clean close above the upper-right boundary line is your official green light to buy. It confirms that sellers have completely surrendered and a major upward trend has officially launched.
🔍 Two Simple Signals to Watch
1. The Volume Shift (Expansion to Dry-Up)
Keep a close eye on trading volume throughout both halves of the diamond pattern.
- The Logic: Volume stays high and chaotic during the left side (the broadening phase). Crucially, volume should steadily dry up to near-zero levels as the price gets squeezed into the right tip. When the upward breakout happens, you must see a sudden volume spike confirming institutional buying.
2. The Broken Resistance Line Retest
After snapping through the upper-right boundary, the price will frequently pull back to test that line from above.
- The Logic: The old diagonal resistance line flips into a fresh floor of support. A successful bounce off this line provides an exceptionally safe, low-risk entry point for a long trade.
💡 The Simple Secret
Think of a Diamond Bottom as an inverted head-and-shoulders pattern with V-shaped necklines. The left side represents seller exhaustion, while the right side shows buyers quietly absorbing supply. To calculate your target profit distance after the breakout, measure the maximum vertical distance from the lowest trough in the center up to the highest peak in the center—the price will very often rally that exact same vertical distance once it escapes the top-right line of the diamond.

You Don't Want a Good Trade. You Want a Story.
Some traders don't really want consistency.
They want the trade.
The one they'll screenshot.
The one they'll tell their friends about.
The one that turns $500 into $5,000.
The one they'll post with a caption like:
"Patience paid off."
And suddenly, they're not just a trader anymore.
They're THE trader.

That's where the trouble starts.
Because once you're hunting a legendary trade, ordinary profits start feeling boring.
A clean 1R winner?
"Meh."
A small, well-managed gain?
"Not enough."
But a trade that could potentially make 10R?
Now you've got their attention.
So they start doing things their normal process would never allow.
Holding longer than planned.
Increasing size.
Giving a setup more room.
Taking trades with ridiculous risk because, "This could be the one."
And sometimes it works.
That's the dangerous part.
A huge win can reward terrible behavior.
You take one reckless trade, make a fortune, and suddenly your brain decides:
"See? I knew I had it in me."
Now you're addicted to the feeling.
The next trade needs to be bigger.
More exciting.
More impressive.
Before long, you're not trading an edge.
You're auditioning for a story.
I once watched a trader give back weeks of steady gains chasing one spectacular move.
He wasn't trying to make money anymore.
He was trying to prove something.
That he wasn't average.
That he had what it takes.
That he could pull off the trade everyone would remember.
But here's the uncomfortable truth:
Your identity doesn't need to be validated by one trade.
And neither does your strategy.
Professional trading is usually much less glamorous than social media makes it look.
Small edges.
Repeated decisions.
Boring execution.
Controlled losses.
Another setup.
Another day.
That's the game.
The trader who makes 1R consistently isn't less skilled than the trader who occasionally catches 10R.
In many cases, they're much more dangerous to compete against.
Because they're not waiting for a miracle.
They're building something repeatable.
So the next time you feel yourself getting excited about "the big one," pause.
Ask yourself:
"Would I still take this trade if nobody ever knew I made it?"
If the answer is no...
You might not be chasing profit.
You might be chasing validation.
And that's an expensive thing to hunt.
The market doesn't care whether your next trade becomes legendary.
It only cares whether you managed the risk.
Stop trying to create a trading story worth telling.
Build a process worth repeating.
That's how traders become dangerous.
Not with one unforgettable trade...
But with hundreds of forgettable ones done exceptionally well.