Sandisk Shares Surge 35%
....................................................................................................................



Good morning!The stock market is starting the new week in wait-and-see mode, taking a moment to look around after racking up three straight winning weeks.
Futures are moving in different directions this Monday morning: tech-focused Nasdaq contracts are inching up slightly, while the S&P 500 is holding flat and the Dow is dipping just a bit. With big economic reports taking a backseat over the next few days, Wall Street's focus is shifting away from tech giants and onto the everyday American shopper.
Over the coming days, retail heavyweights like Walmart, Target, Home Depot, and Lowe’s will release their quarterly scorecards. These reports matter because they show whether regular consumers are still spending money freely or tightening their belts as the back-to-school shopping season kicks into gear.
At the same time, investors are feeling a lot calmer about interest rates. Thanks to a mix of cooling job growth and steady inflation numbers, traders have dialed back the chances of a Federal Reserve rate hike in September to less than a one-in-three shot.
Still, a couple of stubborn pressures remain in the mix. Oil prices are creeping back up toward $88 a barrel amid ongoing Middle East tensions, and bond yields pushed higher to finish last week. When the Fed releases the meeting minutes from its last policy gathering on Wednesday, traders will be combing through every line to see how close officials really are to pausing their rate hikes for good.

📊 Stock Futures Dip Following S&P 500's Three-Week Win Streak
U.S. stock index futures edged lower on Monday morning following three consecutive weeks of solid market gains. Dow futures slid 108 points (0.2%), while S&P 500 and Nasdaq-100 contracts dipped 0.17% and 0.28%, respectively, as investors consolidated positions following last week's record-setting earnings momentum and continued geopolitical developments in the Middle East.
💾 SanDisk Surges 35% in Five Days as Valuation Jumps to $243B
SanDisk (SNDK) shares extended their rapid winning streak to five consecutive sessions, posting a cumulative 35% gain and adding roughly $63 billion in market value. The move brings the storage manufacturer's enterprise valuation to approximately $243 billion, pushing its year-to-date performance up 591% amid heavy investor focus on memory hardware fundamentals.
📈 Micron Approaches $1,000 Level on Emerging Catalysts and Apple Speculation
Micron Technology shares rose 1% in overnight trading as market participants watched for a potential reclaim of the key $1,000 price threshold. Following a sharp sector-wide pullback in July, memory hardware providers have seen renewed accumulation, supported by expectations of tightening supply and upcoming consumer hardware product cycles.
💻 AMD Jumps 5% After Pricing $4.75B Bond Sale for AI Expansion
Shares of AMD gained 5.1% after the chipmaker successfully priced a $4.75 billion debt offering. The capital raise is designated to support the company's aggressive infrastructure roadmap and operational expansion across enterprise artificial intelligence and next-generation data center accelerators.
⚠️ ECB Warns U.S. AI Stock Market Correction Could Have Broad Fallout
A new research post from European Central Bank economists cautioned that stretched valuations across U.S. technology equities carry a high risk of an eventual market correction. The authors highlighted that constrained fiscal and monetary buffers across major economies could leave policymakers with limited room to absorb broad macroeconomic spillover.
🛢️ Oil Fluctuates Near $89 as Stalled U.S.-Iran Talks Slow Hormuz Flows
Crude benchmarks gave up early morning gains on Monday, with Brent crude easing to $89.28 a barrel and WTI sliding to $81.74. While tanker incidents near the Strait of Hormuz supported a 5% gain last week, stalled diplomatic discussions have kept energy desks cautious regarding prolonged regional friction.
🪙 XRP Active Addresses Reach Two-Month High Despite Bearish Social Sentiment
On-chain participation on the XRP Ledger reached its highest active address count in over two months, even as retail social sentiment dropped to multi-month lows. The sharp divergence highlights strong underlying network interaction and wallet transfers despite sluggish price performance across the digital asset market.

Small Wins Don't Matter If Your Losses Are Bigger
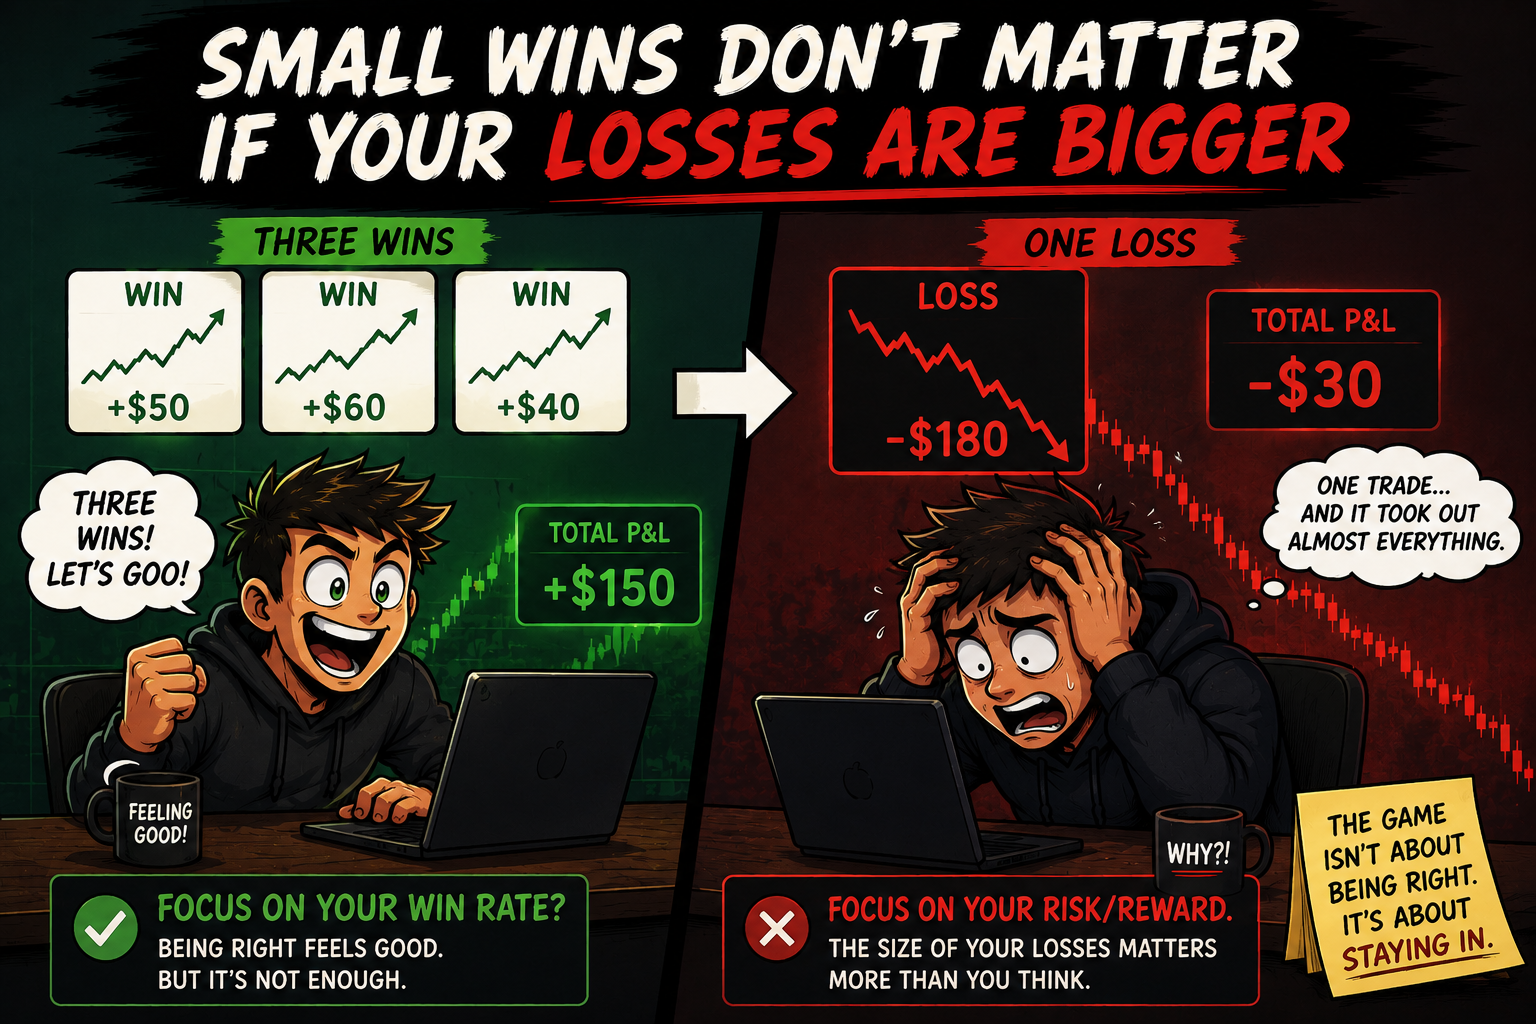
You win three trades.
You feel good.
Then one losing trade wipes out most of what you made.
That's the asymmetric outcome problem.
Many traders focus on being right instead of looking at how much they're making when they're right and how much they're losing when they're wrong. They take profits quickly because they don't want a winner to turn into a loss, but they keep losing trades open because they hope they'll recover.
So the wins stay small.
The losses keep getting bigger.
Strong traders think about the size of their outcomes, not just their win rate. They know where they're willing to take a loss, and they give good trades enough room to develop instead of cutting winners out of fear.
Because you don't need to win every trade.
You need your winners and losers to make sense together.
When your losses stay controlled and your winners have room to grow, a few bad trades don't erase weeks of progress.
Being right feels good.
Managing the outcome matters more.
Trading isn't just about finding winning setups. It's also about understanding risk, position sizing, and how small decisions affect your overall results.
If you'd like to explore more thoughtful market perspectives, you can discover a few market newsletters here:

Broadening Formation
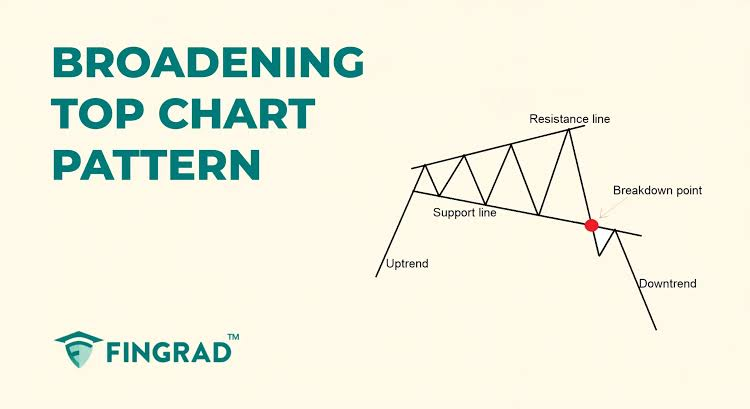
Broadening Formation (Megaphone) Breakdown Structure. Source: Fingrad
The Broadening Formation (commonly known as the Megaphone Pattern or Inverted Symmetrical Triangle) is a high-volatility chart pattern characterized by diverging trendlines. Unlike standard triangles that squeeze into a point, a Broadening Formation expands outward, making consecutive higher highs and lower lows. It signals that the market is in an emotional tug-of-war, with wild swings between aggressive buyers and panic sellers before a definitive breakout occurs.
🔴 The Red Zone (The Expanding Upper Resistance)
The Meaning: The price surges to make fresh, higher highs along the upward-sloping upper trendline, only to get aggressively slapped down each time.
The Move: Do not chase breakouts at the top boundary. In a broadening formation, each new high triggers severe rejection because the market lacks institutional consensus. Buying near the upper line leaves you exposed to immediate, violent pullbacks.
🟡 The Yellow Zone (Inside the Expanding Megaphone)
The Meaning: The price swings back and forth with growing amplitude between the two widening trendlines, expanding the overall trading range.
The Move: Exercise caution. Standard trend-following strategies will get chopped up here due to widening whipsaws. Swing traders can trade the bounces off the extreme boundaries, but conservative traders should wait for the pattern to resolve.
🟢 The Green Zone (The Boundary Breakout / Breakdown)
The Meaning: The price reaches one of the outer boundary lines (most commonly the lower support line in a Broadening Top) and decisively smashes through it with heavy momentum.
The Move: Go! A clean candle close outside the expanding trendlines confirms that one side has completely overwhelmed the other. A breakdown below the lower support line signals a major shorting opportunity, while a breakout above the upper line signals trend continuation.
🔍 Two Simple Signals to Watch
1. The 5-Swing Reversal Rule
Broadening formations typically resolve after completing five distinct alternating swings (Points 1–2–3–4–5).
- The Logic: Swings 1, 3, and 5 test the upper resistance, while swings 2 and 4 test the lower support. If the price reaches Point 5 at the upper resistance and fails to sustain momentum, it often initiates a rapid, one-way crash straight down toward a full breakdown through the floor.
2. The Expanding Volume Profile
Unlike squeezing patterns where volume contracts, broadening formations often exhibit increasing or erratic volume.
- The Logic: Volume tends to expand as the swings grow wider, reflecting emotional retail participation and institutional distribution. When the ultimate breakout or breakdown occurs, a heavy spike in volume confirms that the tug-of-war is over and the new trend is genuine.
💡 The Simple Secret
Think of the Broadening Formation as a loudspeaker amplifying market emotion. As fear and greed take turns dominating the market, the swings get wider and more volatile until the system loses stability and breaks out. To estimate your minimum target distance after a breakout, measure the vertical distance between the highest peak and lowest trough inside the formation—the resulting trend frequently covers that exact same distance in the direction of the break.

You Were Right. You Just Couldn't Sit Through It.
The trade is working.
Price moves in your direction.
You're up nicely.
And then that little voice appears:
"Maybe I should just take it."
You tell yourself you're being smart.
Protecting profits.
Playing it safe.
So you close.
A small win.
Feels good.
Then price keeps moving.
And keeps moving.
And keeps moving.
Suddenly, the trade you exited for +0.5R is sitting at +3R.
Now you're staring at the chart thinking:
"Why did I get out?"

This is one of the cruelest trading habits because the original decision often looks responsible.
You didn't lose money.
You didn't break your stop.
You locked something in.
But if you repeatedly cut your winners short because you're afraid they'll disappear, you're creating a very different problem.
You're letting fear decide your exit.
I knew of a trader who had a simple pattern.
He could sit through a losing trade for an hour without blinking.
But give him a decent profit and suddenly he became the world's fastest profit-taking machine.
+0.4R?
Gone.
+0.7R?
Gone.
The moment the trade started feeling good, he wanted to make the feeling permanent.
That's the trap.
You aren't always taking profits because the trade is finished. Sometimes you're taking profits because you're afraid of losing the profit you've already seen.
And those are not the same thing.
Think about what happens psychologically.
At entry, you're risking money you haven't lost yet.
Once you're profitable, you're protecting money you haven't actually earned yet.
Your brain suddenly treats unrealized profit like something that belongs to you.
So when price pulls back a little, it feels like something is being taken away.
You panic.
You close.
Then price resumes without you.
The answer isn't to stubbornly hold every trade until your target gets hit.
Sometimes taking profit early is absolutely correct.
The important question is:
"Did my exit come from my trading plan, or from my fear?"
That's the distinction.
If your strategy says take partials at 1R, fine.
If your structure says the trend has invalidated, get out.
But if nothing changed except the fact that you're now looking at a green number...
You may not be managing the trade.
You may simply be trying to make the anxiety disappear.
Try this:
Before entering a trade, decide what would make you exit early.
Not after you're sitting on profit.
Before.
That way, your future self doesn't get to rewrite the rules just because the P&L looks delicious.
Because here's the uncomfortable truth:
A profitable trade can still be a badly managed trade.
You don't become a better trader by collecting more winning trades.
You become better by learning to let your winners develop according to the plan you trusted before the money started flashing green.
Sometimes the hardest part of trading isn't taking the loss.
It's having the courage to sit quietly while you're winning.