Samsung Electronics Slides 8%
....................................................................................................................


It’s Monday.
And Wall Street has decided to start the week with a little tension.
US stock futures are mixed after trade talks between the US and Canada broke down over the weekend, with new US tariffs on Canadian goods adding another layer of uncertainty. Dow futures are hovering around the red, while S&P 500 and Nasdaq futures are slipping.
But the bigger story this week could be Nvidia.
The AI chip giant reports earnings on Wednesday, and investors are watching closely. Nvidia has become one of the biggest symbols of the AI boom that has helped power the stock market higher. The problem? Expectations are already sky-high.
So the question isn’t simply whether Nvidia will beat estimates.
It’s whether the results will be good enough to keep investors excited.
And then there’s the Federal Reserve’s Jackson Hole Symposium later this week, where markets will be listening closely for clues about interest rates.
Throw in the latest US-Canada trade tensions and potential new sanctions against Iran, and traders have plenty to keep an eye on.
It’s Monday.
But with Nvidia, the Fed, tariffs, and geopolitics all competing for attention, the market apparently skipped the Monday warm-up and went straight to the main event.

₿ Bitcoin Surges 23% as U.S. Debt Concerns Fuel New Rally
Bitcoin logged a 23% rally following warnings from analysts, including Ray Dalio, that the U.S. could face a major debt crisis within three years. The Treasury Department's unexpected interventions and bond buyback plans have pushed fresh liquidity into digital assets as an alternative macro hedge.
📊 Wall Street Awaits Nvidia Earnings and Jackson Hole Policy Speeches
Investors are bracing for a high-stakes week headlined by Nvidia’s (NVDA) quarterly earnings report, key upcoming inflation figures, and central banker speeches at the Jackson Hole Symposium. Macro sentiment remains on edge as market participants also await Washington's formal economic strategy announcement regarding Iran.
📱 Samsung Electronics Slides 8% as $79B Shareholder Return Disappoints
Shares of Samsung Electronics dropped over 8% in early Seoul trading following the rollout of its record $79 billion shareholder-return package. Investors sold off the stock amid disappointment over the lack of concrete clarity regarding large-scale share buybacks and the proportion of AI windfalls returned to shareholders.
🛢️ Oil Dips as Investors Await Toughest U.S. Sanctions Against Iran
Crude benchmarks declined on Monday morning as energy markets digested the upcoming rollout of Washington's toughest-ever sanctions campaign against Tehran. Treasury Secretary Scott Bessent is scheduled to unveil the full economic isolation package later in the day.
🇨🇳 Alibaba Plunges Following $10.2B Share Placement to Fund AI Push
Alibaba shares tumbled after the Chinese e-commerce giant announced a $10.2 billion share placement, earmarking all net proceeds for AI infrastructure investments. The heavy fundraising move comes shortly after the company reported a 75% drop in quarterly profit weighed down by heavy technology spending.
🛢️ Oil Snaps Two-Week Winning Streak on U.S. Sanctions Focus
Crude prices retreated after back-to-back weekly gains, with traders scaling back risk premiums while assessing the scope of the White House’s Iranian economic isolation plan. Energy desks remain watchful of supply flow implications across the Middle East.
💵 Dollar Pinned Near Multi-Month Lows on Debt Buyback Nerves
The U.S. dollar hovered near multi-month lows on Monday as currency markets digested the Treasury’s plans to buy back long-dated bonds. Foreign exchange desks maintained a cautious stance ahead of the Jackson Hole Symposium and fresh updates on Middle East trade sanctions.

The Market Doesn't Move the Same Way All Day
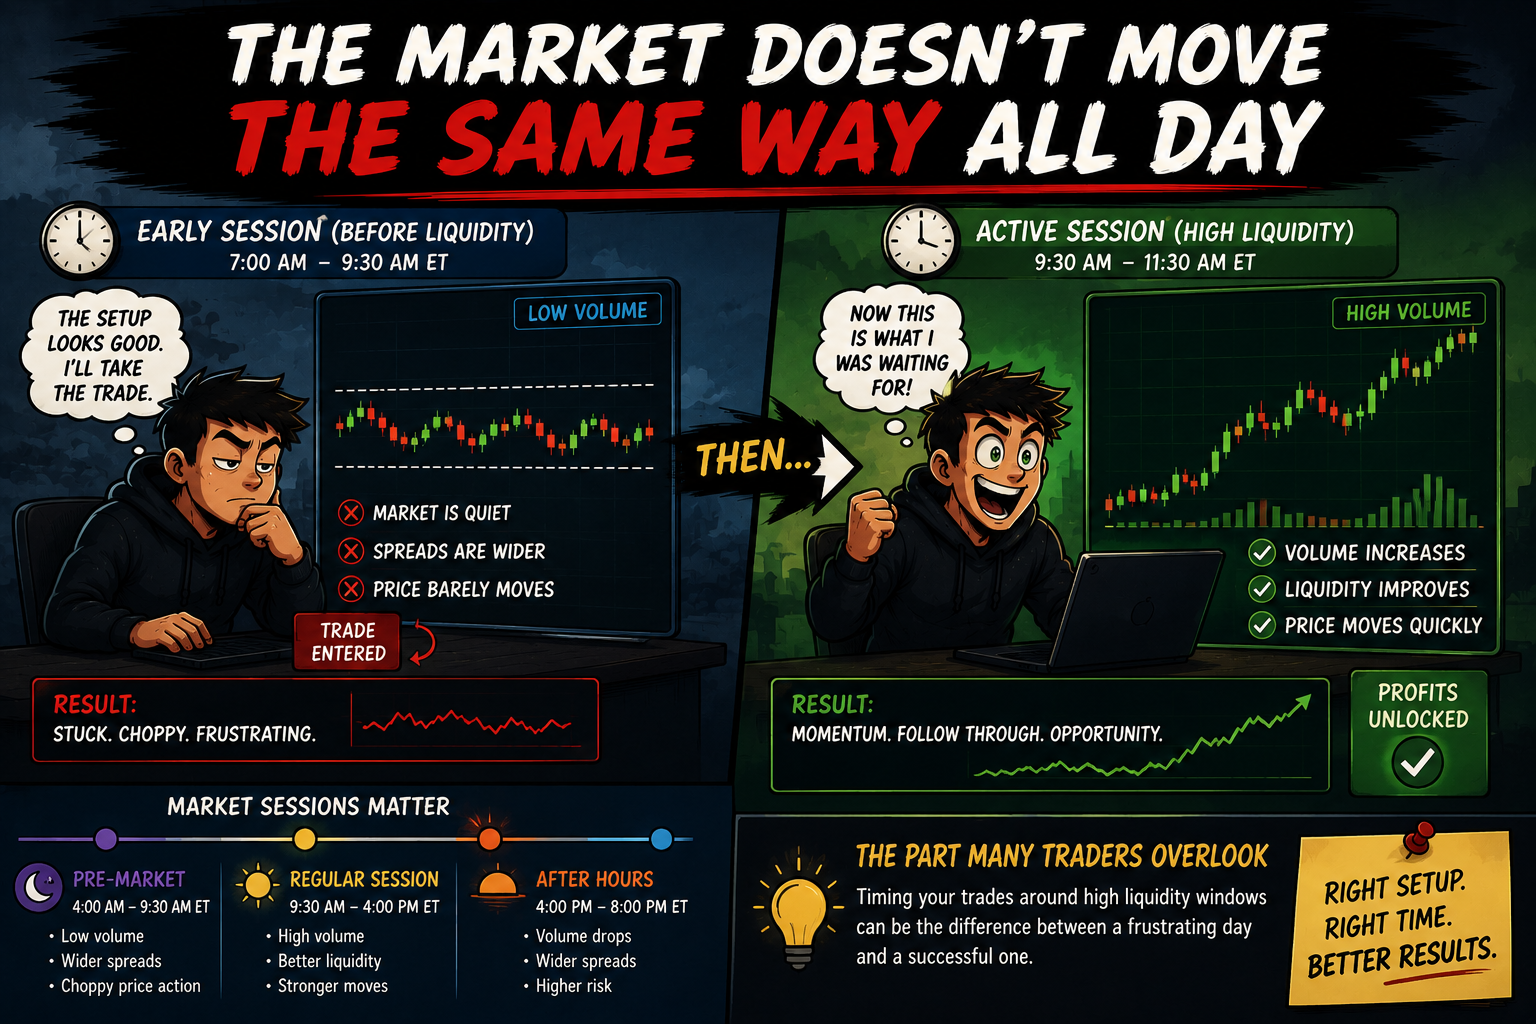
You open your chart.
The setup looks familiar, so you take the trade.
But the market is quiet. Spreads are wider. Price barely moves.
Then the session opens and everything changes.
Volume increases. Liquidity improves. Price starts moving quickly.
That's the part many traders overlook.
Liquidity isn't constant throughout the trading day. Some periods attract far more buyers and sellers than others. Major market opens, overlaps, and key economic releases can bring a completely different level of activity.
If you treat every hour the same, you may be trading when conditions aren't suited to your strategy.
Strong traders know when their market is most active. They understand which sessions provide the liquidity their strategy needs and which periods are better left alone.
Because a good setup in the wrong environment can still be a bad trade.
You don't need to trade every hour the market is open.
Sometimes the best decision is simply to wait for the right window.
Timing matters in trading. Understanding when markets are most active can change how you approach entries, execution, and risk.
If you'd like to explore more thoughtful market perspectives, you can discover a few market newsletters here:

Keltner Channel
The Keltner Channel is a volatility-based envelope indicator created by Chester Keltner and modernized by Linda Bradford Raschke. It places three dynamic lines directly over the price chart: a central Exponential Moving Average (EMA) (typically 20 periods) flanked by an Upper Channel Line and a Lower Channel Line calculated using a multiplier of the Average True Range (ATR) (usually 2×ATR). It adapts smoothly to market volatility to identify trend direction, momentum breakouts, and overextended reversals.
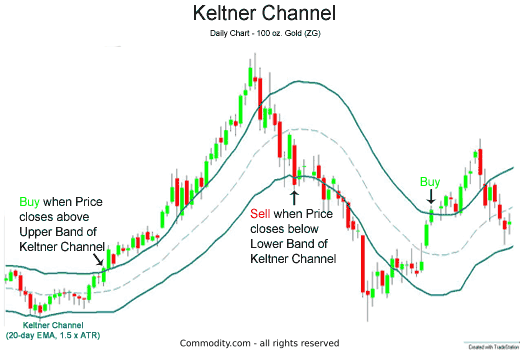
Keltner Channel Upper and Lower Breakouts. Source: Commodity.com
🔴 The Red Zone (Breaching the Lower Band)
The Meaning: The price punches through and closes below the Lower Channel Line. This indicates heavy downside momentum where selling velocity is expanding beyond the asset's typical daily volatility range. The Move: Protect capital. In trend-following setups, this signals an active bear trend or breakdown. For counter-trend mean-reversion traders, an extreme stretch far below the lower band warns that a snapback toward the center line is building up.
🟡 The Yellow Zone (Inside the Channel & The Middle EMA)
The Meaning: The price fluctuates comfortably between the upper and lower bands, crossing over the central 20 EMA line. The Move: Hold and wait. The market is trading within normal expected volatility limits. In an established trend, the middle EMA line acts as dynamic support or resistance, offering low-risk pullback entries.
🟢 The Green Zone (Punching the Upper Band)
The Meaning: The price powers through and closes above the Upper Channel Line. This proves that buyers are driving the price higher faster than the average true range can expand. The Move: Go! A strong candle close outside the upper band confirms an aggressive bullish breakout. It shows that institutional momentum is driving a new trend rather than standard market noise.
🔍 Two Simple Signals to Watch
1. The 20 EMA Pullback Ride
In a strong bull trend, the price doesn't just stay outside the bands—it breathes and pulls back.
- The Logic: When the price is riding an uptrend along the upper band, look for mild pullbacks that touch or dip slightly toward the middle 20 EMA line. If the candle tests the EMA and bounces back upward, it provides a high-probability continuation entry with a tight stop-loss placed just below the middle line.
2. The TTM Squeeze (Keltner vs. Bollinger Bands)
One of the most famous trading setups combines Keltner Channels with Bollinger Bands.
- The Logic: Because Bollinger Bands use standard deviation and Keltner Channels use ATR, Bollinger Bands contract much faster during quiet periods. When the Bollinger Bands squeeze completely inside the Keltner Channel, the market is storing massive explosive energy. When the Bollinger Bands expand back outside the Keltner Channel, a powerful directional breakout begins.
💡 The Simple Secret
Think of the Keltner Channel as a custom-tailored shock absorber for price. While Bollinger Bands expand and contract sharply on every single spike, Keltner Channels use Average True Range (ATR), giving you a much smoother, steadier highway lane. If the price breaks through either guardrail, it isn't an everyday fluctuation—it is a clear sign that volatility has expanded and a major trend is underway.

The Losing Streak Isn't the Real Problem
Three losses.
Then four.
Then five.
You look at the account.
The number is lower than it was last week, but you tell yourself:
"It's just variance."
So you keep trading.
Same size.
Same frequency.
Same strategy.
Then another loss.
Now you're down enough that you can feel it.
But instead of slowing down, you do something very human:
You try to make the drawdown disappear as quickly as possible.
Because admitting you're in one means asking uncomfortable questions.
Is the strategy struggling?
Have I changed the way I'm executing it?
Has the market changed?
Am I forcing trades because I want the losses back?
Those questions are uncomfortable.
So you avoid them.
You trade.
A trader I knew once went through a rough stretch that lasted several weeks.
Every time someone suggested reducing his size, he'd push back.
"I'm not going to start trading scared."
It sounded confident.
But there was something underneath it.
He didn't want smaller positions.
He wanted to prove that nothing was wrong.
That distinction cost him.
Because the drawdown wasn't just reducing his account.
It was changing his decision-making.
He became more impatient.
He took marginal setups.
He watched his P&L more closely.
And because he kept trading full size, every mistake became more expensive.
That's the part traders often miss:
A drawdown can change the trader before it changes the strategy.
And if you refuse to acknowledge what's happening, you lose the opportunity to find out which one it is.
Now, this doesn't mean every losing streak requires you to cut your size.
A perfectly valid strategy can lose several trades in a row.
That's normal.
But you should have a process for when a drawdown gets your attention.
Maybe you review your last 20 trades.
Maybe you compare recent execution against your historical results.
Maybe you temporarily reduce risk.
Maybe you stop trading for a day and review.
The important thing is that the response is planned, not emotional.
Because there's a big difference between saying:
"I'm reducing size because my rules tell me to review."
and:
"I'm keeping full size because I refuse to admit I'm struggling."
One is risk management.
The other is pride.
And pride is expensive in this business.
So when you're in a drawdown, don't immediately ask:
"How do I make the money back?"
Ask:
"What is this drawdown trying to tell me?"
Maybe the answer is nothing. Just variance.
Maybe your edge has weakened.
Maybe your execution slipped.
Maybe your market has changed.
You won't know until you stop pretending everything is normal.
A drawdown doesn't make you a bad trader.
Refusing to examine it can.
The goal isn't to escape every losing streak quickly.
It's to make sure you don't turn a normal losing streak into a much bigger problem simply because your ego couldn't handle admitting:
"Something needs a closer look."