Brent Past $97 Per Barrel
....................................................................................................................



It’s Monday.
And while Wall Street is taking the day off, the rest of the world is still trading — and watching the Middle East closely.
European stocks opened slightly lower this morning, with the Stoxx 600 down about 0.1%. Germany, the UK, and France were all in the red.
Asia had a different mood. Japan’s Nikkei jumped 2.12%, while South Korea’s Kospi surged 4.61%. China was more mixed, with the CSI 300 edging higher.
But the big story remains the U.S.-Iran conflict.
The U.S. struck three Iranian oil tankers over the weekend, while Iran reportedly targeted U.S. warships with ballistic missiles. Hopes for a quick nuclear deal are also fading, with Energy Secretary Chris Wright saying an agreement may not happen anytime soon.
That matters for markets because the longer the conflict drags on, the bigger the risk to energy prices, inflation, and interest-rate expectations.
And with U.S. markets closed today for the holiday, traders get a rare chance to watch everyone else react first.
Wall Street gets the day off.
Geopolitics doesn’t.

🌍 European Equities Slide as Middle East Conflict Weighs
European benchmark indices retreated Monday morning, with the Stoxx 600 slipping 0.1% and Germany’s DAX shedding 0.14% as investors tracked escalating U.S.-Iran hostilities. In contrast, Asia-Pacific bourses broadly gained, supported by selective risk appetite even as geopolitical headlines dominated sentiment.
🛢️ Oil Extends Gains as U.S.-Iran Tanker Strikes Escalate
Crude prices gained more than $1 a barrel, lifting Brent toward $96.28 and WTI to $91.48 following reciprocal strikes on commercial and military vessels around the Strait of Hormuz. Energy traders are pricing in deeper supply bottlenecks as maritime traffic through the critical export corridor slows sharply.
💵 Dollar Wobbles Despite Rising Expectations for Fed Rate Hikes
The U.S. dollar struggled for traction on Monday despite rising market bets on additional Federal Reserve policy tightening. Lingering worries over sovereign debt expansion, synchronized global rate hikes driven by energy inflation, and broad Japanese yen strength curbed the greenback’s yield advantage.
💻 Asian Tech Shares Rally Ahead of Critical U.S. CPI
Semiconductor and technology shares in Seoul and Tokyo advanced on Monday, underpinning a mixed session across Asia-Pacific bourses. Institutional desks are looking past Friday's robust U.S. payrolls data as they reposition portfolios ahead of this week's pivotal U.S. inflation report.
🍬 Sugar Outperforms S&P 500 Following 21.5% August Surge
Sugar futures have advanced roughly 20% year-to-date, surpassing the S&P 500’s 13% gain after logging a 21.5% spike in August—its strongest monthly run since 2010. The rally has been propelled by lower European sugar beet yields, Brazilian crop reductions, and Asian weather disruptions.
₿ Bitcoin Hits Resistance Near $82,000 as Weekend Momentum Stalls
Bitcoin traded in a tight band around $80,000 after failing to sustain a weekend breakout attempt above $82,000. Despite lighter volume causing the initial run to stall, the digital asset continues to hold above all major daily moving averages.
💴 Yen Reaches Seven-Month Peak on BOJ Tightening Speculation
The Japanese yen rallied over 1% to 154.58 per dollar on Monday, touching its strongest level since February. The sharp move was driven by increasing bets on Bank of Japan rate hikes alongside capital repatriation flows from domestic institutional investors.

Trading One Market Leaves You Exposed
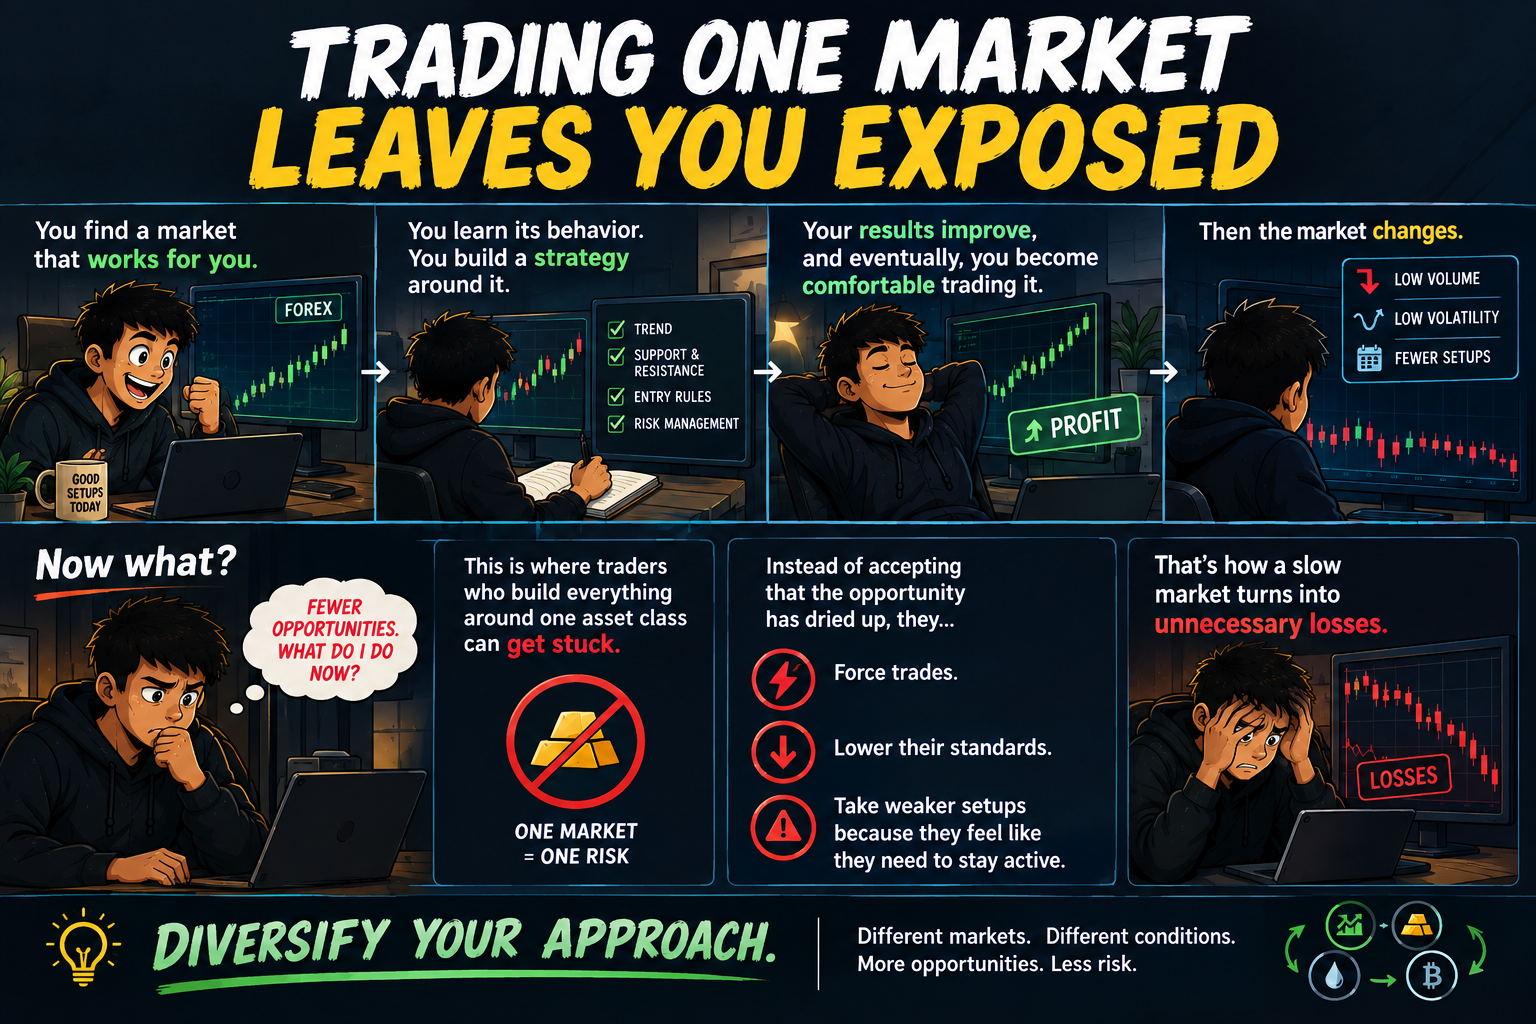
You find a market that works for you.
You learn its behavior. You build a strategy around it. Your results improve, and eventually, you become comfortable trading it.
Then the market changes.
Volume drops. Volatility disappears. Your setups become less frequent. The conditions that made your strategy profitable are no longer there.
Now what?
This is where traders who build everything around one asset class can get stuck.
Instead of accepting that the opportunity has dried up, they force trades. They lower their standards. They take weaker setups because they feel like they need to stay active.
That's how a slow market turns into unnecessary losses.
A strategy can be good and still have periods where it doesn't work. The problem is not always the strategy. Sometimes the market simply isn't providing the conditions it needs.
That's why having a contingency plan matters.
You might have another market you understand. Another strategy designed for different conditions. Or simply a rule that tells you when to stop trading and wait.
The goal isn't to trade everything.
It's to avoid being completely dependent on one source of opportunity.
Markets change. Liquidity changes. Volatility changes. Your best market today may not be your best market six months from now.
A flexible trader doesn't force an opportunity when the market isn't offering one.
They know when to adapt — and when to wait.
There is always more happening in the markets than what's directly in front of you. Reading different perspectives can help you spot opportunities, risks, and changing conditions you may otherwise overlook.
Explore more market newsletters here:

Volume Oscillator
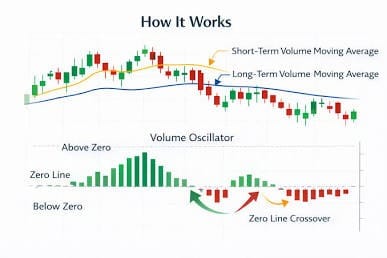
Volume Oscillator Zero Line Structure and Mechanics. Source: EBC Financial Group
The Volume Oscillator measures the relationship between two volume moving averages (typically a fast period like 5 or 14, and a slow period like 10 or 28).
Expressed either as a difference or a percentage relative to a central Zero Line, it filters out single-day noise to show whether market participation is expanding or contracting. By tracking the flow of trading activity rather than price alone, it confirms breakouts, validates trends, and flags deceptive moves.
🔴 The Red Zone (Sinking Deep Below Zero)
The Meaning: The oscillator drops into negative territory (below 0). Short-term volume has dried up and is lagging behind the longer-term average, signaling low liquidity and institutional disinterest. The Move: Exercise caution with breakout trades. If price is advancing while the Volume Oscillator is negative or dropping, the rally lacks institutional fuel and is vulnerable to a sharp reversal.
🟡 The Yellow Zone (Hovering at the Zero Line)
The Meaning: The oscillator oscillates tightly around the 0.00 baseline. Short-term trading volume is virtually identical to longer-term historical averages. The Move: Hold and wait. The market is in an equilibrium state of volume turnover. Avoid trading continuation moves until volume visibly breaks out of the flat band.
🟢 The Green Zone (Crossing Firmly Above Zero)
The Meaning: The oscillator climbs into positive territory (above 0). Short-term trading volume is outpacing the longer-term baseline, indicating a surge in market participation. The Move: Go! A crossover above zero confirms that fresh capital is driving the current price direction—whether that direction is a bullish rally or an aggressive sell-off.
🔍 Two Simple Signals to Watch
1. Trend Validation vs. Volume Divergence
The Volume Oscillator does not measure whether the market is going up or down—it measures whether conviction is increasing or decreasing.
- The Logic: If the price is making higher highs while the Volume Oscillator is rising above zero, the uptrend is strongly confirmed. If the price makes higher highs but the Volume Oscillator makes lower highs or slips below zero, buyer participation is fading, warning of an imminent reversal.
2. The Breakout Confirmation Filter
Use the Zero Line to eliminate fake-outs at key chart levels (necklines, channels, or horizontal resistance).
- The Logic: When price pierces a key breakout level, check the Volume Oscillator immediately. A valid breakout must be accompanied by the oscillator surging above zero. If price breaks out while the oscillator remains pinned below zero, the breakout is likely a trap.
💡 The Simple Secret
Think of the Volume Oscillator as the fuel gauge on a car's accelerator. Price action shows where the vehicle is steering, but the Volume Oscillator reveals whether there is real gas in the engine. When the line crosses above zero, the throttle is open and institutions are committing capital. When it falls below zero, the car is merely coasting on fumes—no matter how fast it looks on the price chart.

When Your Favorite Market Goes Quiet
You build your whole trading routine around one market.
You know its personality.
You know the session.
You know the setup.
You know what a normal pullback looks like.
Then one day...
Nothing.
The market slows down.
Volatility dries up. Your setup stops appearing. Breakouts go nowhere. The clean moves you've built your strategy around simply aren't there.
And now you're stuck.
Because you never planned for "nothing."

So you start forcing it.
You lower your standards.
Take weaker setups.
Trade smaller timeframes.
Increase frequency.
Maybe you start telling yourself the market is "about to move."
It isn't.
You're just trying to make your favorite market interesting again.
This is the danger of building your entire trading identity around one asset class.
When conditions are good, specialization feels like an advantage.
And it can be.
But when your market goes quiet, the lack of a backup plan creates a weird psychological pressure:
"I need to make something happen here."
That's when patience disappears.
A trader who normally takes three trades a week suddenly takes twelve.
Not because opportunity increased.
Because boredom became uncomfortable.
And that's how a quiet market turns into an expensive market.
The answer isn't to become a trader who watches everything.
You don't need to suddenly trade currencies, commodities, indices, crypto and wheat futures just because your main market went to sleep.
That's another form of chaos.
What you need is a contingency plan.
Know what you do when your primary market doesn't offer your conditions.
Maybe you have a second market with a similar setup.
Maybe you switch to a higher timeframe.
Maybe you simply don't trade.
That last option is underrated.
"No opportunity" IS a valid market condition.
The important thing is deciding that before you're sitting in front of a dead chart trying to manufacture a reason to click.
Ask yourself:
"What is my plan when my best market stops behaving the way my strategy needs it to?"
If the answer is "I'll figure it out that day," you're probably going to figure it out emotionally.
And markets are a terrible place to improvise.
Specialization gives you depth.
But flexibility gives you longevity.
You don't need to trade everything.
You just need enough awareness to recognize when your market isn't offering your edge anymore.
Sometimes the professional move isn't finding a new trade.
It's knowing when your favorite market has nothing for you...
...and being completely okay with that.