Nvidia Buys Hugging Face for $12.9B
....................................................................................................................


TGIF.
And Wall Street is ending the week with one eye on the jobs report.
US stock futures are mostly quiet this morning, with Dow futures slipping slightly while the S&P 500 edges higher and Nasdaq-100 futures climb 0.4%. After Thursday’s strong rally, traders seem happy to sit back and wait for the next big piece of information.
That information is the August jobs report.
Economists expect the US to have added 55,000 jobs, following an unexpected decline in July. The labor market has been showing signs of sluggish but stable growth — which sounds boring, but boring is sometimes exactly what markets want.
There’s also growing attention on interest rates.
Fed Governor Chris Waller said he was leaning toward keeping rates steady, causing traders to reduce their expectations for another rate increase in September. The market is now roughly split on what the Fed will do next.
Meanwhile, Lululemon is having a very different Friday.
The stock plunged 18% in premarket trading after the company cut its revenue and profit outlook.
So, jobs data for the market.
Bad guidance for Lululemon.
And hopefully, a quiet finish to the week.
TGIF, traders.

📊 U.S. Stock Futures Subdued Ahead of Crucial August Jobs Report
Wall Street futures traded in a tight band early Friday as investors braced for the pivotal August nonfarm payrolls release to gauge the path of Federal Reserve interest rate policy. S&P 500 and Nasdaq contracts remained cautious after a volatile week dominated by rising sovereign yields and escalating geopolitical tensions.
💻 Nvidia Agrees to Acquire Hugging Face for $12.93B
Nvidia reached an agreement to acquire leading open-source AI platform Hugging Face for $12.93 billion, marking one of the largest acquisitions in the semiconductor giant's history. The transaction significantly deepens Nvidia's software ecosystem across open-weight models, datasets, and global developer workflows while committing to preserve the platform's multi-cloud and hardware neutrality.
🛢️ Oil Poised for Steepest Weekly Advance Since Mid-July
Crude benchmarks pushed higher Friday, with Brent rising toward $96 a barrel and WTI climbing past $92, securing their strongest weekly gains in nearly two months. The rally has been propelled by renewed U.S.-Iran military skirmishes in the Persian Gulf and ongoing transit restrictions across the Strait of Hormuz.
₿ Bitcoin Reclaims $80,000 as Macro Sentiment Signals Crypto Winter End
Bitcoin surged back above the key $80,000 psychological threshold, extending its late-summer momentum as digital asset funds continue to absorb steady institutional inflows. Analysts noted that resilient sovereign debt hedging and cooling macro liquidity pressures suggest the prolonged crypto bear market is officially ending.
🚗 Volkswagen Considers Aggressive Cost Cuts and Tariffs Squeeze Margins
German automotive giant Volkswagen flagged potential European plant closures and head-count reductions to protect cash flows. The automaker is navigating steep competitive pressure from Chinese domestic EV manufacturers alongside rising cross-border trade tariffs that have compressed operating margins.
🤖 Nvidia Expands AI Footprint with $99B Infrastructure Investment Strategy
Nvidia highlighted an aggressive roadmap detailing up to $99 billion in ecosystem capital allocations and strategic partnerships across data center hardware, networking, and foundational software stacks. The massive capital outlay is aimed at solidifying its competitive moat amid soaring enterprise AI compute requirements.
🧘 Lululemon Shares Wobble Post-Earnings on North American Demand Moderation
Lululemon Athletica reported fiscal second-quarter earnings that highlighted steady double-digit international sales growth offset by slowing traffic across its core North American footprint. Management noted consumer discretionary spending remains selective, prompting a measured full-year revenue outlook.

Building a Real Edge Takes Longer Than You Think
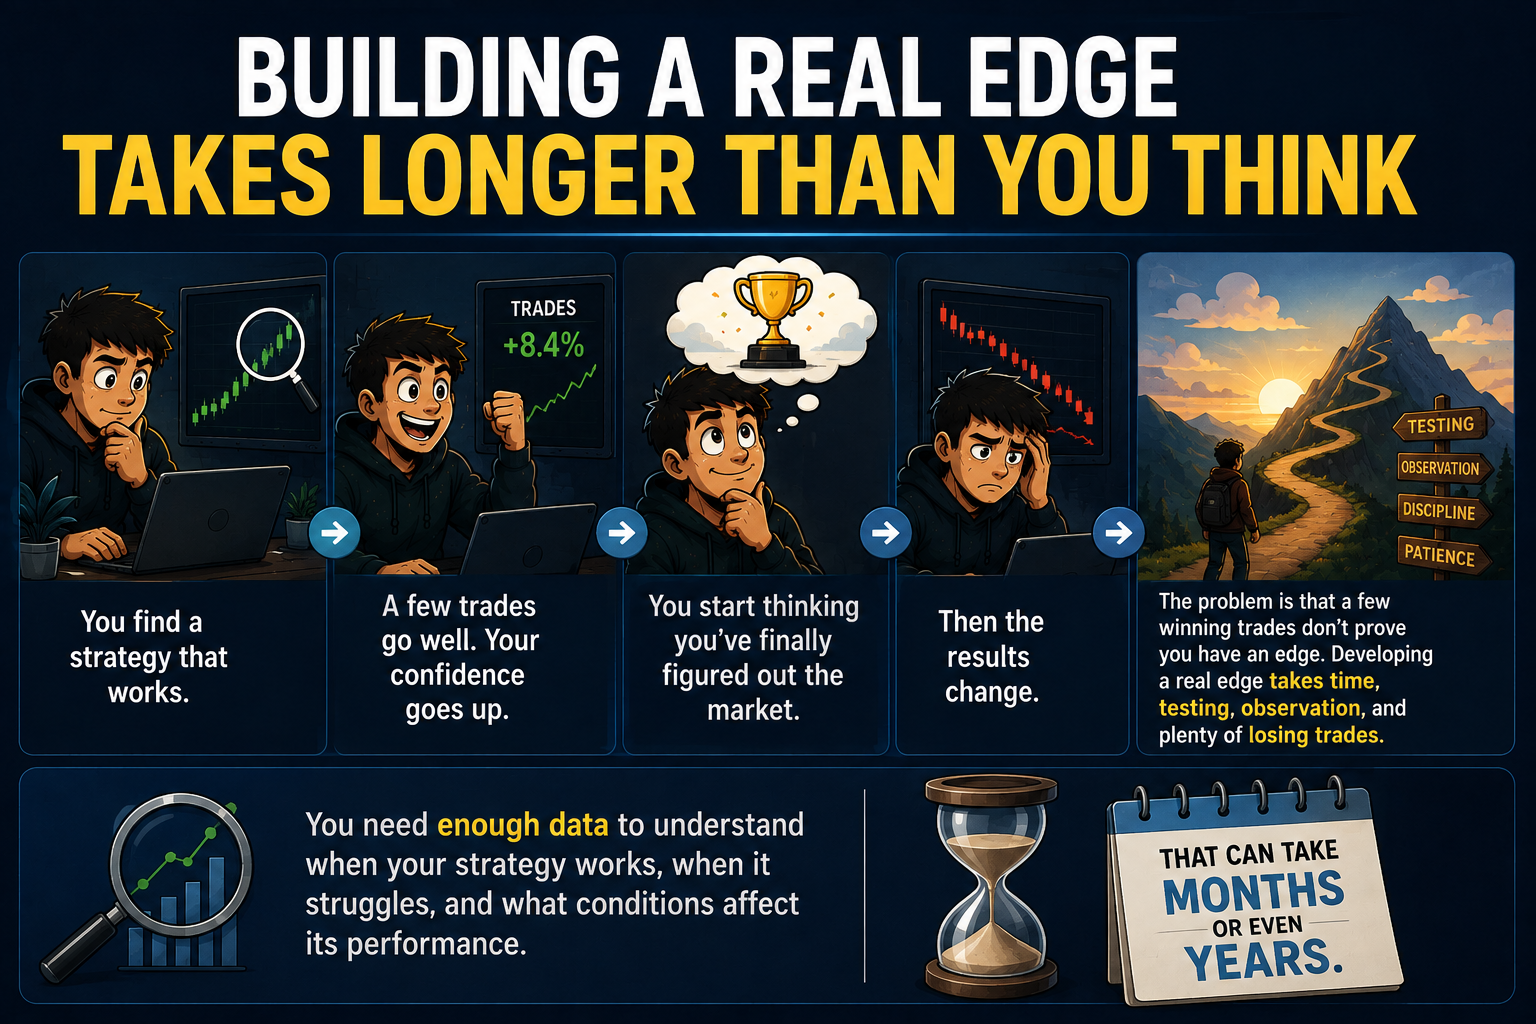
You find a strategy that works.
A few trades go well. Your confidence goes up. You start thinking you've finally figured out the market.
Then the results change.
The problem is that a few winning trades don't prove you have an edge. Developing a real edge takes time, testing, observation, and plenty of losing trades.
You need enough data to understand when your strategy works, when it struggles, and what conditions affect its performance.
That can take months or even years.
But traders often want results immediately. They jump from one strategy to another when the first one doesn't produce quick profits. They change indicators, timeframes, entry rules, and risk levels before they've collected enough evidence to know what actually works.
Now they're constantly starting over.
A real edge isn't something you discover in a weekend.
It's something you develop by repeatedly testing an idea, measuring the results, identifying weaknesses, and refining your process.
The goal isn't to find a strategy that wins every time.
It's to build a process you understand well enough to know when you have a statistical advantage — and when you don't.
Give the process enough time to prove itself.
Good trading takes more than finding the next strategy. It takes learning how other traders think about markets, risk, and execution.
If you want more perspectives to add to your reading list, explore these market newsletters:

The Evening Star
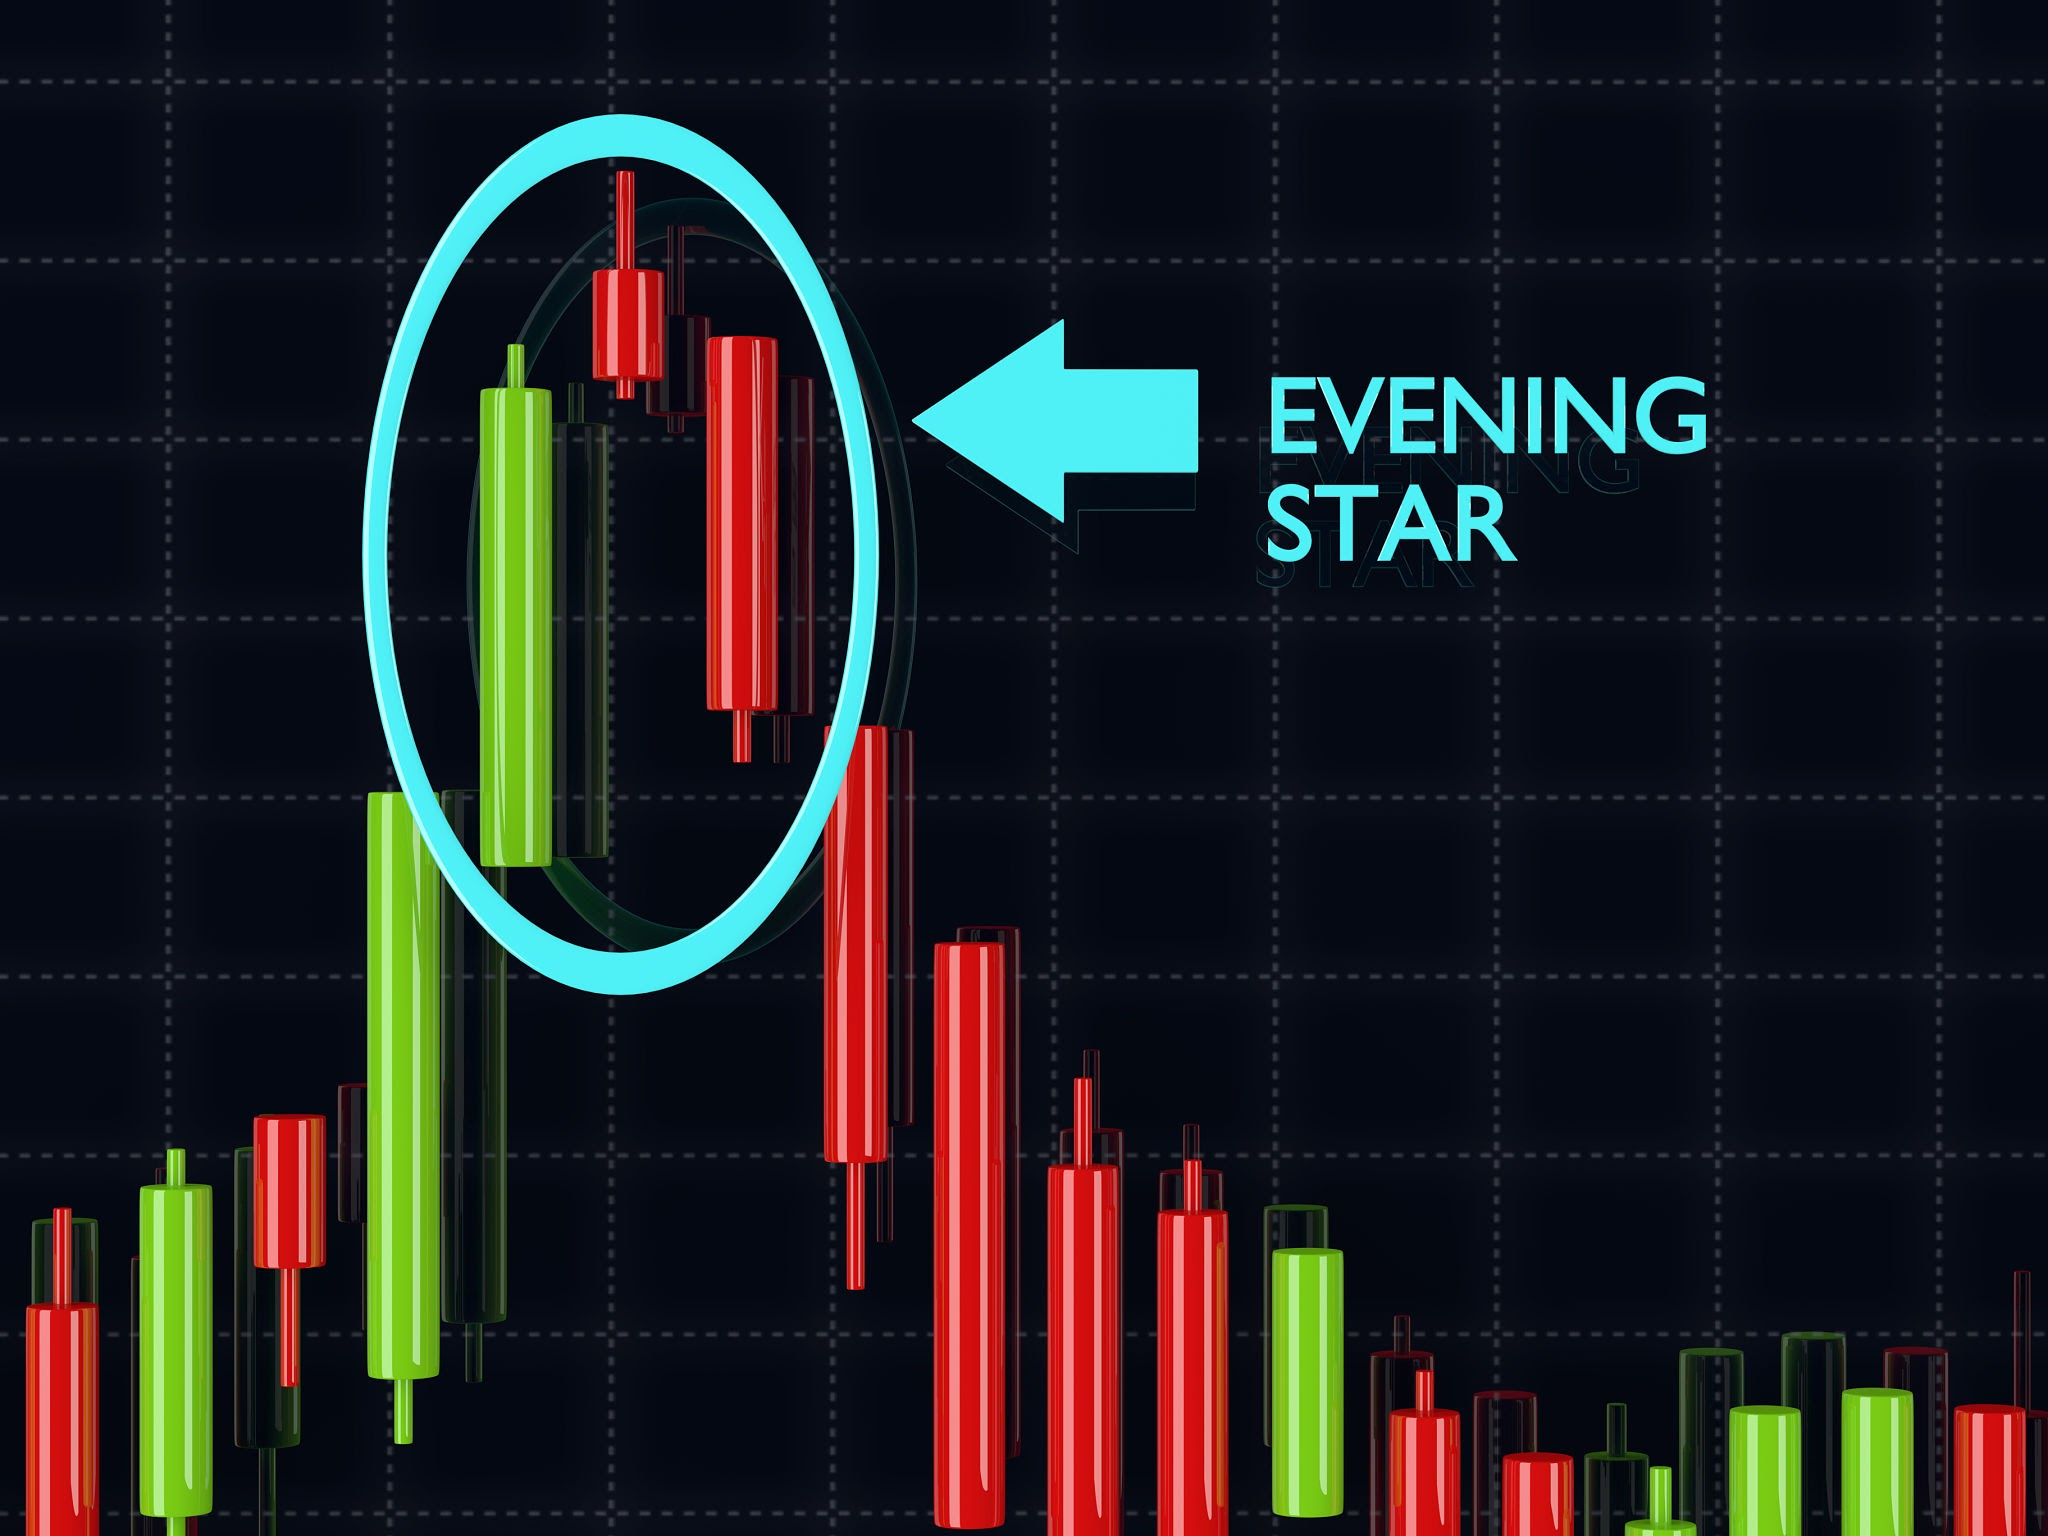
Evening Star Three-Candle Bearish Reversal Structure. Source: ayo888 / Getty Images
The Evening Star is a premier three-candle bearish reversal pattern that appears at the peak of an extended uptrend or rally. It acts as the exact mirror image of the Morning Star, marking the transition from strong buying euphoria to market hesitation, followed by a sharp influx of aggressive selling. Just as the evening star precedes the dark night, this pattern signals that the uptrend has burned out and darkness is falling on prices.
🔴 The Red Zone (Candle 1: The Bullish Momentum)
The Meaning: A tall, decisive green (bullish) candle prints in the direction of the prevailing uptrend. Buyers appear to remain fully in control, driving prices higher with optimism.
The Move: Do not chase new long positions here. While the trend still looks healthy on the surface, look out for signs of exhaustion, especially if the candle is pushing into major resistance or an overbought zone.
🟡 The Yellow Zone (Candle 2: The "Star" of Exhaustion)
The Meaning: A small-bodied candle (green, red, or a Doji) gaps or prints higher than the first candle. Its tiny body shows that despite reaching new highs, buying momentum has stalled out and the market is deadlocked.
The Move: Watch closely. The buyers have lost their ability to create continuation, but sellers haven't taken over yet. This is your high-alert warning that a market top is forming. Tighten stop-losses on existing longs.
🟢 The Green Zone (Candle 3: The Bearish Confirmation)
The Meaning: A large red (bearish) candle plunges downward, closing deeply into—and usually past the 50% midpoint of—the first green candle's body.
The Move: Go! A confirmed close on the third candle is your official green light to exit longs or enter a short position. Place your stop-loss just above the highest wick of the middle "Star" candle to manage risk.
🔍 Two Simple Signals to Watch
1. Depth of the 50% Body Penetration
Examine how far the third red candle cuts into the first green candle's body.
- The Logic: For a valid Evening Star, the third candle must close past at least 50% of the first candle's real body. If the red candle completely engulfs the first green candle, it reflects severe institutional liquidation, signaling an even stronger downward reversal.
2. The Volume Confirmation Shift
Track the volume signature across the three candles in the formation.
- The Logic: Volume is often moderate on Candle 1, noticeably drops or dries up on Candle 2 (showing buyers lack the conviction to keep driving prices up), and surges heavily on Candle 3 (confirming institutional distribution and panic selling). A volume spike on the third candle confirms the top is locked in.
💡 The Simple Secret
Think of the Evening Star as gravity finally catching a thrown ball. On day one, the ball is rocketing upward (Candle 1). On day two, it hangs practically motionless at its highest peak in mid-air (Candle 2). On day three, gravity takes over and the ball plunges downward (Candle 3). When this three-act sequence occurs at a key resistance level or overbought oscillator reading, it provides one of the cleanest top-reversal signals in technical analysis.

Why Do You Still Need to Watch It?
You set the alert.
Price reaches your level.
Ping.
The notification you've been waiting for all morning finally goes off.
And then...
You open the chart anyway.
You stare at it.
You zoom in.
Watch the candle form.
Check another timeframe.
Maybe even pull up the order book.

At this point, you might as well cancel the alert and admit you're volunteering for a full-time surveillance job 😂
The funny thing is, the alert did exactly what you asked.
It told you:
"Your condition has been met."
But you still don't trust it.
So you watch manually.
Not because the setup requires it.
Because your brain wants to see the trade happen.
That's the Alert Dependency.
And underneath it is something deeper than technology.
It's anxiety disguised as vigilance.
You think watching gives you more control.
But watching every tick often creates the opposite.
Now a tiny pullback feels important.
A wick looks suspicious.
One candle makes you question the entire idea.
The alert got you there.
Your anxiety talked you out of it.
This is especially common when traders are trying to trade around busy schedules.
They set alerts so they can step away...
Then spend the next hour checking the chart every seven minutes just in case 😭
So what's the point of the tool?
The whole reason you created the alert was to stop monitoring something that didn't need constant monitoring.
But a tool can't fix a behavior you're not ready to trust.
And that's the real lesson here.
You don't have a technology problem.
You have a trust problem.
You haven't decided what evidence is enough.
So even when your predefined condition occurs, your brain keeps asking for more.
One more candle.
One more confirmation.
One more glance.
And that never-ending need for certainty is exhausting.
Before your next trading session, decide something very clearly:
What exactly does this alert mean?
Does it mean:
"Take the trade."
Or:
"Come back and evaluate the setup."
Once you've defined that, stick to it.
Because an alert should trigger a process, not a fresh emotional debate.
And there's another useful test.
The next time your alert fires, notice your first instinct.
Do you think:
"Great. My setup is here."
Or:
"Wait... let me make sure."
That second reaction is worth investigating.
Because sometimes the problem isn't that your alert is unreliable.
It's that you haven't built enough trust in your own rules to step away from the screen.
A trader who needs to watch every tick isn't necessarily more disciplined.
Sometimes they're just more anxious.
Real confidence is being able to set the conditions...
Walk away...
And return when the condition you defined actually matters.