Panic Sellers Batter Indonesian Markets
....................................................................................................................



Happy Monday, traders! 📈
After last week's tech sell-off, investors are trying something familiar this morning: buying the dip. But is this the start of a comeback, or just a little relief before the next round of worries?
US stock futures are climbing, led by the Nasdaq-100, up 1.16%. S&P 500 futures have gained 0.58%, while Dow futures are up 87 points. Intel is jumping more than 4% in premarket trading after JPMorgan upgraded the chipmaker, and CoreWeave is also recovering after a brutal week.
Here's the catch: the AI trade has a credibility problem.
The S&P 500 fell nearly 2% last week, while the Nasdaq dropped 4.5%, ending its four-week winning streak. Investors are questioning whether AI companies can sustain their enormous spending plans and generate enough returns to justify the investment. Even strong revenue growth from Anthropic has sparked questions about whether the pace is fast enough.
Debt is another concern. Investors are becoming more cautious about companies borrowing heavily to build AI infrastructure, putting pressure on AI-related stocks and corporate credit.
Oil is still lurking in the background. Attacks on energy infrastructure and rising tensions around the Persian Gulf have traders watching supply risks, even as crude prices edge lower today.
Now comes another test: earnings from Meta and Tesla later this week. Their results could help restore confidence—or give investors another reason to worry.
The bulls are buying the dip. But this week, AI companies need to show that the growth story still adds up.

📈 U.S. Futures Rebound Ahead of Mega-Cap Tech Earnings
U.S. stock index futures rebounded early Monday following the Nasdaq’s steepest weekly drop since early June. Institutional desks stepped in ahead of high-profile quarterly earnings releases from Netflix, Tesla, and Meta, though retail positioning remained cautious after recent technology volatility.
🇮🇩 Panic Selling Batters Indonesian Equities on MSCI Expulsion Warning
Indonesian financial markets suffered heavy liquidation on Monday, extending a record two-day rout on the Indonesia Stock Exchange. The selloff was triggered by a formal warning from global index provider MSCI regarding potential benchmark exclusion, increasing pressure on regulators in Jakarta to resolve long-standing market structure and liquidity concerns.
🪙 Bitcoin Breaks Above $83,000 on Binance Spot Market
Bitcoin climbed past the $83,000 threshold during early Monday trading, touching $83,012 on Binance's spot exchange. The digital asset maintained positive short-term momentum, building on steady institutional demand and shrugging off recent volatility across broader technology equities.
🥇 Gold Rises Toward $4,180 as Warsh Comments Cool October Hike Odds
Spot gold advanced toward $4,180 an ounce to open the week after Federal Reserve Chairman Kevin Warsh delivered remarks interpreted as favoring a policy pause at next week's meeting. Money markets unwound rate-hike wagers, driving the implied probability of an October quarter-point rate increase down below 20%.
📊 Options Traders Position for Volatility Spike Amid AI and Inflation Jitters
Derivatives desks are heavily buying volatility protection as accelerating U.S. inflation data and recurring tremors across AI infrastructure equities rattle Wall Street. Traders are increasingly hedging against expectations that severe price swings in mega-cap technology will spill over into the broader S&P 500 index.
🌏 Asian Tech Equities Trade Mixed as Return-on-Investment Worries Linger
Technology bourses across Asia delivered a mixed performance Monday, supported by pre-earnings bargain hunting but constrained by persistent skepticism regarding AI capital expenditure returns. Rising borrowing costs and elevated input inflation continue to test investor patience regarding near-term monetization across regional chipmakers and hardware suppliers.
🚗 Tesla and SpaceX Edge Higher on Gary Black $420 Buyout Speculation
Tesla (TSLA) rose 0.6% and SpaceX (SPCX) advanced 1.2% in overnight trade heading into Monday. The buying followed commentary from Future Fund managing director Gary Black projecting that SpaceX could announce an all-stock acquisition of Tesla at $420 per share in the coming weeks, framing upcoming product reveals as a catalyst to consolidate Elon Musk’s corporate empire.

Your Watchlist Is So Big, You're Missing the Best Trades

You have 40 stocks on your watchlist. Maybe 60. Every morning, you open your charts, scroll through the list, and try to figure out which ones deserve your attention.
By the time you finish checking a few, a promising setup on another chart has already played out.
Sound familiar?
A large watchlist feels productive. More stocks mean more opportunities, right? Not necessarily. The more markets you try to monitor, the harder it becomes to track price levels, recognize developing patterns, and act when a setup finally appears.
You start jumping between charts. You spot a move halfway through and chase it. You miss an entry you had planned for because you were watching something else. By the end of the day, you've spent hours looking at charts but still feel like you missed the trades that mattered.
The problem isn't a lack of opportunities. It's that your attention is spread too thin to recognize them properly.
You don't need to watch everything. Start with a smaller list of markets that fit your strategy. Learn how they move, identify your key levels, and focus on the setups you understand best.
A focused watchlist won't guarantee better trades, but it gives you a better chance of spotting opportunities without constantly feeling behind.
You can't catch every move in the market. But you shouldn't be missing your best setups because you're too busy watching everything else.
Understanding a fund's costs and daily behavior can help you avoid surprises after entering a trade.
Explore more market newsletters here

Ease of Movement
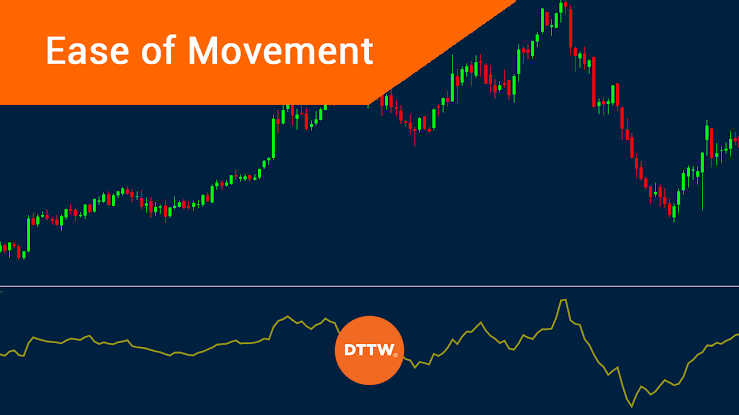
Developed by Richard W. Arms Jr. (the creator of the Arms Index / TRIN), the Ease of Movement (EOM or EMV) indicator quantifies the relationship between price change and volume to measure how effortlessly price can advance or decline. Instead of simply measuring whether volume is high or low, EOM asks: how much volume did it take to move price this far? By dividing the midpoint price move by a volume-to-range box ratio—and smoothing the result with a moving average (typically 14 periods)—EOM oscillates above and below a central Zero Line to expose whether a trend is gliding through thin air or struggling against heavy friction.
🔴 The Red Zone (Deep Negative Territory / Plunging Below Zero)
- The Meaning: The EOM line slides well below the Zero Line. Price is falling with ease—meaning the market is shedding value rapidly without requiring enormous volume to do so, as buyers have completely vacated the order book.
- The Move: Protect capital. Avoid bottom-fishing or stepping in front of the drop. In trend-following strategies, a sustained negative reading confirms that overhead selling pressure faces no structural resistance from buyers.
🟡 The Yellow Zone (Hugging the Zero Line / High Volume Stall)
- The Meaning: The EOM line flattens out tightly against the 0.00 baseline.
- The Move: Hold and wait. When EOM is near zero, either the price is locked in a tight consolidation with small ranges, OR heavy volume is churning with zero net price progress (high friction). Avoid entering breakout trades while EOM is pinned to zero, as the market is absorbing orders without directional displacement.
🟢 The Green Zone (High Positive Territory / Surging Above Zero)
- The Meaning: The EOM line crosses and holds firmly above the Zero Line. Price is rising effortlessly on relatively light to moderate volume because sellers are offering virtually no resistance.
- The Move: Go! A decisive cross above zero is your primary green light to ride an uptrend. When EOM expands into high positive values, it confirms that bulls are moving the tape upward with minimal friction.
🔍 Two Simple Signals to Watch
1. The Zero-Line Crossover Trigger
Arms designed the Zero Line as the master boundary separating buying efficiency from selling efficiency.
- Bullish Crossover: When the smoothed 14-period EOM crosses above the Zero Line, it signals that the path of least resistance has flipped upward. It marks an optimal trend-following entry trigger.
- Bearish Crossover: When EOM crosses below the Zero Line, downward price travel has become effortless, signaling an exit for longs or an entry trigger for short positions.
2. High-Friction Divergence (The Heavy Volume Exhaustion)
Because EOM penalizes massive volume that fails to yield large price moves, divergences reveal hidden institutional absorption.
- The Logic: If the price is grinding to new highs but the EOM line is failing to make higher peaks—or actually slopes downward toward zero—the rally is encountering massive "friction." Institutions are quietly dumping shares into the bids, requiring enormous volume just to push the price an inch higher. This bearish divergence flags an imminent trend exhaustion.
💡 The Simple Secret
Think of Ease of Movement as checking whether a car is driving on a clear highway or dragging its wheels through thick mud.
When EOM is high above zero, the road is completely wide open—the engine barely has to work (light/moderate volume) to hit 80 mph because there is zero traffic (no sellers). When EOM drops near zero despite huge volume, the engine is redlining at 6,000 RPM but the car is stuck in the mud—warning you that the tires are spinning out and the rally is about to stall.

You’re Trading the Number
You’re $200 away from your first payout.
Suddenly, every candle looks promising.
A setup you’d normally skip?
Tempting.
A bigger position?
Worth considering.
One more trade before closing the laptop?
Why not?
You’ve stopped trading your strategy. Now you’re trading the number.
And the market couldn’t care less.
It doesn’t know you’re close to withdrawing. It won’t give you a winning trade because you’ve been patient for three weeks.
But you start forcing entries anyway. You increase your risk. You abandon your rules because waiting feels too slow.
Then one bad trade wipes out three good days.

All that progress, gone because you couldn't leave the money alone.
Here’s the fix: stop measuring your session by how close you are to a payout. Measure it by how well you followed your plan.
Keep your risk fixed. Skip weak setups. Walk away when your rules say stop.
Even if you’re $50 away.
Especially if you’re $50 away.
Remember, the payout is the reward for following your process, not a target worth gambling your account to reach.
Trade your strategy.
Not your withdrawal balance.