Airtel Money Launches Largest London IPO
....................................................................................................................



TGIF, traders!
Tech stocks are bouncing back, oil prices are easing, and Wall Street is trying to shake off yesterday’s AI scare. But before anyone celebrates too early, there are a few things worth watching today.
US stock futures are in the green, led by the Nasdaq-100, up 0.8%. S&P 500 futures have gained 0.3%, while Dow futures are up 0.1%.
First up: AI is back in the spotlight. Reports about OpenAI’s revenue sparked concerns that the AI boom might be losing momentum. But fresh projections suggesting annualized revenue could reach $70 billion or more by year-end have helped calm investors. For now, the big question is whether AI companies can turn enormous expectations into real growth.
Oil is another big story. Brent crude has slipped to around $103 a barrel. That offers some relief, particularly for businesses like airlines that have been dealing with higher fuel costs. Delta Air Lines reports earnings today, giving investors a closer look at how those costs are affecting profits.
And there’s one more number to watch: consumer sentiment. The University of Michigan’s latest survey could reveal how Americans are feeling about the economy and recent price swings.
Next Tuesday, major banks kick off earnings season.
So, three things to keep on your radar today: AI optimism, oil prices, and consumer confidence. A lot can change before the closing bell!

🥇 Gold Slides to Two-Month Low as Fed Prepares for Additional Hike
Spot gold dropped 1.28% to close at $4,109.90 an ounce on October 7, touching its weakest level since early August. Bullion prices faced renewed liquidation after Federal Reserve communications reinforced expectations for another benchmark interest rate increase before year-end, while December gold futures settled down $46.40 at $4,140.70.
🛰️ Telecom Majors Sink as SpaceX Starlink Acquires Nationwide Spectrum
Legacy U.S. mobile carriers slumped in premarket trading Friday following SpaceX’s (SPCX) agreement to acquire a nationwide low-band spectrum portfolio. AT&T (T) dropped nearly 7%, T-Mobile (TMUS) declined over 6%, and Verizon (VZ) slid 5% on fears of direct satellite-to-cellular disruption, while SpaceX shares gained 4%.
💵 Dollar Powers Longest Winning Streak Since Early 2025
The U.S. dollar extended its longest multi-week rally since early 2025 as elevated energy prices continued to pressure the currencies of net energy-importing nations. The greenback drew persistent support from widening interest rate differentials and sticky global inflation prints.
🌏 Foreign Funds Dump $23.5B in Asian Equities Amid Global Bond Rout
Foreign institutional investors turned net sellers of Asian equities in September, offloading $23.49 billion across regional bourses after recording $4.72 billion in net purchases in August. The sharp capital flight across South Korea, Taiwan, India, and Southeast Asia was triggered by surging U.S. Treasury yields and tighter monetary conditions.
🛢️ Oil Drops as Trump Rules Out Iran Attacks Ahead of U.S. Elections
Crude benchmarks retreated Friday after President Donald Trump confirmed the U.S. will not launch military strikes against Iran prior to next month's elections, pointing to productive diplomatic negotiations. Brent futures fell 1.61% to $102.60 a barrel, while WTI slipped 1.43% to $90.18 as immediate supply-disruption premiums eased.
🇬🇧 Airtel Money Gains in London’s Largest IPO in Five Years
Airtel Money began trading on the London Stock Exchange with an initial market valuation of roughly £5.3 billion, marking the City’s biggest public listing in five years. The mobile fintech’s shares rose 2% in early dealings after pricing at £1.96 each, with backers including Mastercard and the Qatar Investment Authority raising £529 million.

A Strategy That Works in One Market May Fail in Another
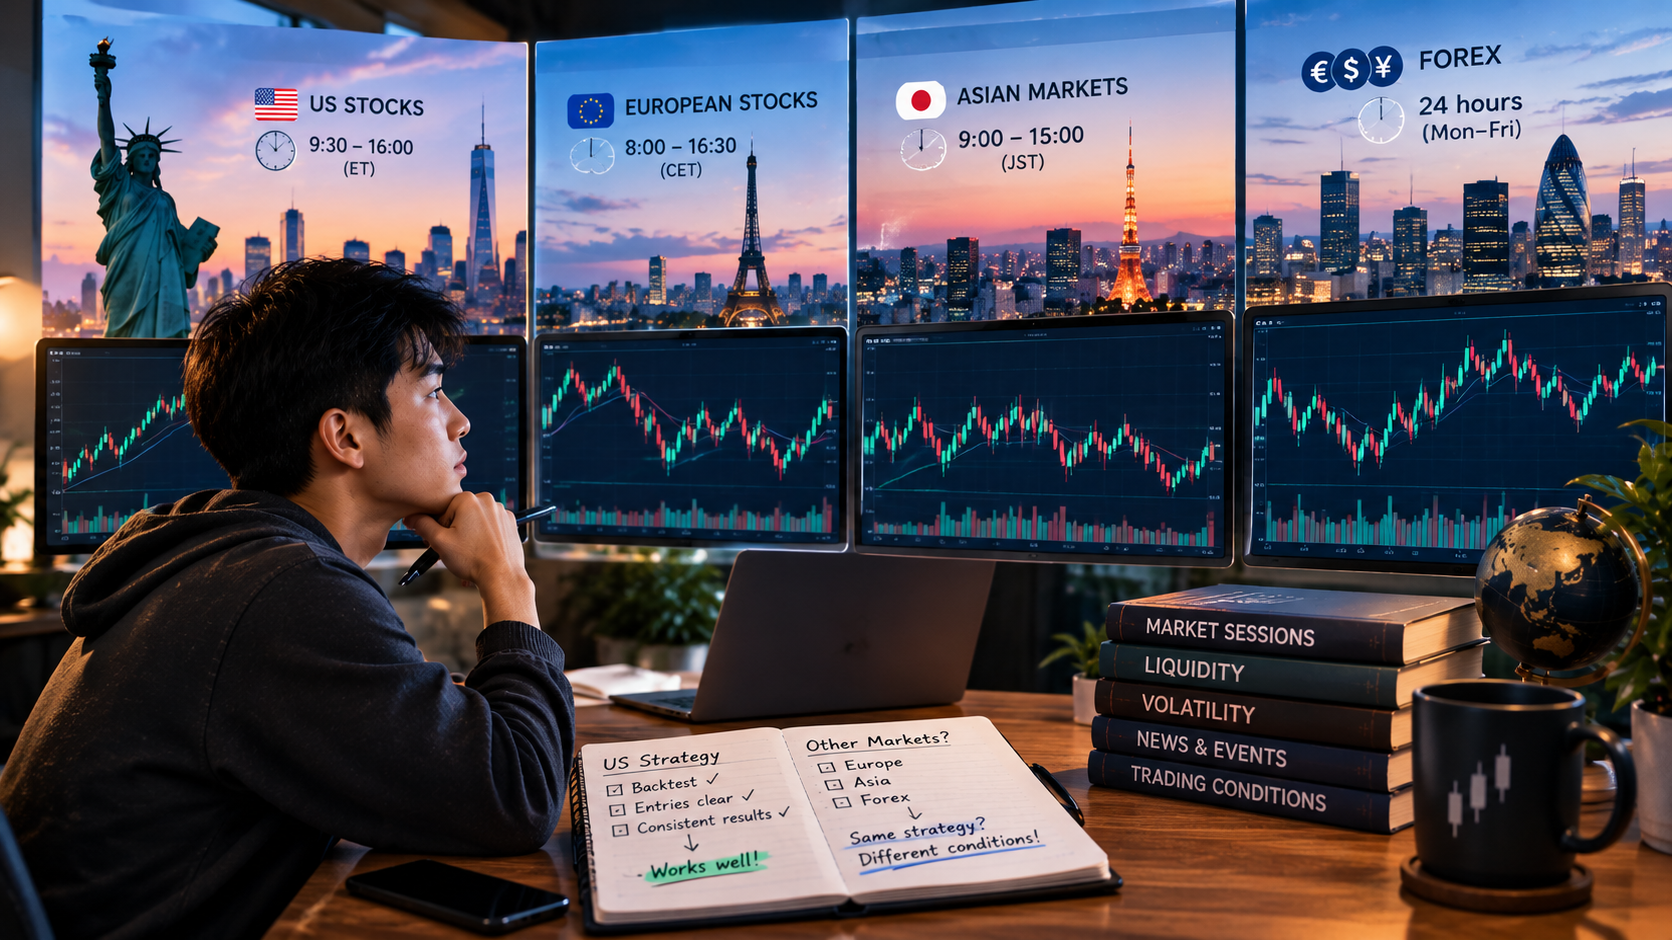
You develop a strategy that works well on US stocks.
The backtest looks promising. The entries are clear. The results are consistent.
So you decide to apply the same strategy to European stocks, Asian markets, and forex.
Why wouldn't it work? A chart is a chart, right?
Not quite.
Markets have different trading hours, liquidity patterns, participant behavior, and reactions to economic news. Even when two markets look similar on a chart, the conditions behind their price movements can be very different.
A breakout strategy that performs well during the US session may struggle in another region where trading activity is lower.
A strategy built around European market openings may behave differently during Asian trading hours.
Even the same asset can move differently depending on which session you're trading and what regional events are influencing it.
The danger is assuming that a strategy's success in one environment automatically proves it will work everywhere.
It doesn't.
Before applying a strategy to a new market, test it under that market's actual conditions. Account for trading hours, liquidity, volatility, transaction costs, and the economic events that influence local participants.
You may discover that the strategy works just as well.
You may also discover that it needs adjustments — or doesn't belong in that market at all.
Don't confuse a strategy that works somewhere with one that works everywhere.
Your edge needs to be tested in the environment where you intend to use it.
Markets share some similarities, but the details can make a difference. Learning how traders approach different regions and trading sessions can help you question assumptions and evaluate your strategies more carefully.
Explore more market newsletters here:

Heikin-Ashi
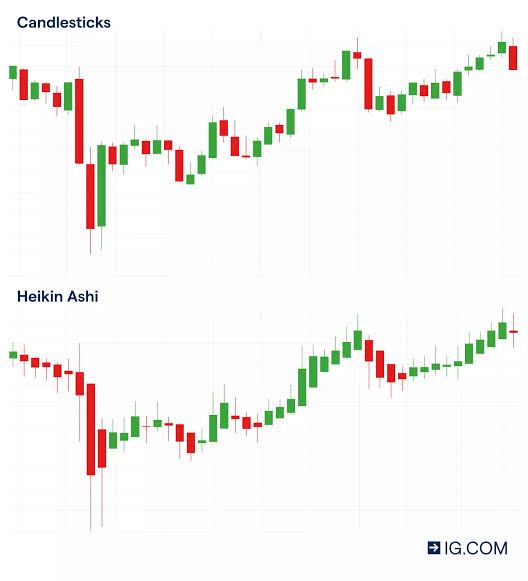
Meaning "average bar" in Japanese, Heikin-Ashi is a specialized charting technique designed to filter out erratic price noise and isolate the underlying trend. Rather than plotting standard raw Open, High, Low, and Close values, it uses an averaging formula where each candle's open is the midpoint of the prior bar and the close is the average of the current bar's four price points:
HA-Open=PriorHA-Open+PriorHA-Close2,HA-Close=Open+High+Low+Close4
This mathematical smoothing replaces chaotic, alternating red and green candles with steady, continuous blocks of color, making trend direction and turning points obvious at a glance.
🔴 The Red Zone (Consecutive Red Bars with No Upper Wicks)
- The Meaning: Solid red candles print with flat tops (zero upper wicks) and long lower shadows. Downward momentum is powerful, steady, and uncompromised by intraday counter-rallies.
- The Move: Protect capital. Stay short or stay completely sidelined from long trades. The absence of upper shadows proves that sellers are in total control—do not attempt to bottom-fish until the candle structure visibly alters.
🟡 The Yellow Zone (Small Bodies with Double Wicks / Dojis)
- The Meaning: The candles shrink in body size and sprout both upper and lower shadows simultaneously.
- The Move: Hold and wait. Double shadows are the universal Heikin-Ashi warning sign for trend exhaustion, consolidation, or an impending reversal. Tighten trailing stops on open trends and wait for a color flip before entering in the opposite direction.
🟢 The Green Zone (Consecutive Green Bars with No Lower Wicks)
- The Meaning: Solid green candles print with flat bottoms (zero lower wicks) and extending upper shadows. Buyers are dominating every session without allowing price to dip below the bar's synthetic open.
- The Move: Go! Flat-bottom green candles are your green light to ride the trend aggressively. Stay in winning long trades as long as the bars maintain full green bodies without lower wicks.
🔍 Two Simple Signals to Watch
1. The "No-Wick" Trend Acceleration Signal
The clearest strength gauge on a Heikin-Ashi chart is the presence or absence of opposing shadows.
- The Logic: A strong uptrend does not just produce green candles—it produces green candles with zero lower wicks. The moment a green candle prints a lower wick, momentum is decelerating. Conversely, a strong downtrend requires red candles with zero upper wicks; the appearance of an upper wick flags that bears are losing their grip.
2. The Color-Flip + Breakout Trigger
Because Heikin-Ashi smooths out single-bar fakeouts, color flips carry significant reversal weight.
- The Logic: After a string of red candles, look for a small indecision bar (double wicks), followed by the first decisive green candle. Entering on the close of the first full green bar—with a stop-loss anchored below the swing low—offers a high-probability entry at the inception of a new trend leg.
💡 The Simple Secret
Think of Heikin-Ashi as putting polarized sunglasses on your price chart. Standard candlestick charts show every blinding reflection and tiny ripple on the water (intraday wicks, gaps, and one-off opposite-color days that scare you out of winning positions). Heikin-Ashi cuts through the glare to show you the deep, powerful current moving underneath—keeping you comfortably in the trend until the tide genuinely turns.

You Couldn't Even Wait 15 Minutes
You made a sensible plan the night before.
"Tomorrow, I'm watching the first 15 minutes. No trades. Just observation."
You wanted to see how price opened, how volatility behaved, where buyers and sellers showed their hands.
A reasonable plan.
Then the opening bell rings.
Within three minutes, a big candle appears.
Price starts moving.
Your brain immediately gets involved.
"That's a breakout."
The next candle pulls back.
"Perfect retest."
Before you know it, you've entered a trade.
Three minutes.
Your 15-minute observation period didn't even survive long enough to become a habit.
And the funniest part?
You probably didn't feel reckless.
You felt decisive.
That's what makes this behavior worth examining.
Sometimes the hardest rule to follow is the one that requires you to do absolutely nothing.

Waiting feels passive. Watching price move without participating feels like missing out. Every candle seems to offer a reason to abandon the plan you made when you were calm.
But what were those 15 minutes for in the first place?
To see whether the opening move had follow-through.
To identify the day's early range.
To avoid confusing the first burst of activity with a genuine opportunity.
You can't gather that information if you're already busy managing a position.
You've turned your observation period into a trade-management problem before the session has even settled.
Here's what I find interesting: you don't necessarily break this rule because you forgot it. You break it because the market makes waiting uncomfortable.
And that discomfort is exactly what the rule was designed to help you handle.
So make the waiting period harder to negotiate.
Set a timer before the session starts. Keep your order panel closed during those 15 minutes. Write down what price does instead of what you wish you'd traded. When the timer ends, assess the chart using your normal entry criteria.
And if a beautiful setup appears in minute three?
Let it go.
Seriously.
You don't have to catch every move to become a good trader.
You need to learn that seeing an opportunity and being required to take it are two completely different things.
Your plan doesn't become less valuable because the market offered something tempting before you were ready.
The first test of your trading day might not be finding a good entry.
It might be keeping the promise you made to yourself before the candles started flying.