BTS World Tour Boosts Hybe 10%
....................................................................................................................



TGIF, traders! 🎉
The market made it through Thursday with a rebound, but don't pop the champagne just yet. The S&P 500 and Nasdaq are still heading toward a losing week, and the AI trade is giving investors plenty to think about.
US stock futures are edging higher this morning. S&P 500 futures are up around 0.16%, Nasdaq-100 futures have gained 0.14%, and Dow futures are up 81 points. Thursday brought some relief, with the Dow jumping more than 500 points as investors moved money out of technology stocks and into other sectors.
So, what's troubling the AI crowd? Competition from China is raising concerns about memory-chip makers, while investors are questioning whether tech companies are borrowing too much to fund their AI expansion. Micron is on track to lose more than 9% this week, while CoreWeave is facing a weekly decline of roughly 15%.
And there's a bigger question underneath all this: Are AI companies growing fast enough to justify their sky-high valuations? Anthropic's latest revenue disclosure has added to the debate, while investors await more transparency from major private AI companies.
Inflation isn't helping either. Consumer prices remain well above the Fed's 2% target, and wholesale inflation just recorded its biggest monthly increase since 2022.
Today's earnings from Travelers and Citizens Financial are also worth watching.
The takeaway?
Tech may be taking a breather, but the market is still searching for proof that the AI boom can deliver.

📊 U.S. Stock Futures Steady Following Tech Relief Bounce
U.S. equity futures traded modestly higher early Friday after the S&P 500 snapped a three-day slide, though major averages remain on track for a negative week. S&P 500 futures added 0.16%, Nasdaq-100 contracts gained 0.14%, and Dow futures climbed 81 points as trading desks absorbed the latest wave of volatility across mega-cap technology shares.
🎤 Hybe Surges 10% on BTS World Tour Outlook and Doubled Revenue
Shares of South Korean entertainment agency Hybe jumped 10% in Seoul, strongly outperforming the broader Kospi's 2.9% advance. Market optimism was propelled by iM Securities' projections that third-quarter revenue will surge 106% year-over-year to 1.5 trillion won ($1.11B), underpinned by a near-tripling of concert ticketing revenues driven by BTS’s global tour.
🥇 Gold Holds Gains Near $4,160 as Sliding Yields Spur Safe-Haven Demand
Spot gold stabilized near $4,160 an ounce after rallying 1.6% in the prior session—its sharpest single-day climb in over two weeks. Bullion drew solid haven bids as an initial rotation out of semiconductor equities spurred a flight into sovereign bonds, driving Treasury yields lower across the curve.
🛢️ Oil Eases on IEA Stock Release but Tracks Weekly Advance
Crude benchmarks softened Friday morning, with Brent slipping 0.44% to $105.45 a barrel and WTI sliding 0.63% to $97.35, yet both contracts remained positioned for a net weekly gain. Upward momentum from a larger-than-expected draw in U.S. crude inventories was tempered by narrowing European diesel margins following the IEA's decision to authorize additional emergency reserve releases.
⚡ BofA Sees Over 100% Upside for CoreWeave on Power Capacity Expansion
Bank of America reiterated a bullish stance on AI cloud provider CoreWeave (CRWV), lifting forward revenue growth projections to 105% for 2027 and 63% for 2028. Analyst Tal Liani highlighted accelerating power infrastructure rollouts of 1.4–1.5 GW annually and expanding revenue per megawatt tied to next-generation Vera Rubin hardware deployments.
📉 Global Semiconductor Rout Deepens as Kospi Drops 7% Overnight
Worldwide chip equities faced severe selling pressure on Thursday after South Korea’s benchmark Kospi plunged 7% overnight. Heavy declines spread to Wall Street, with Nvidia, AMD, Broadcom, Micron, and SK Hynix retreating amid mounting anxieties over AI-related corporate debt financing and persistent Federal Reserve rate-hike expectations.
🏭 TSMC Slips 2% Despite Sixth Straight Record Profit and 51% Revenue Surge
Taiwan Semiconductor Manufacturing Company (TSM) fell 2% as broad semiconductor risk-off sentiment overshadowed blowout quarterly figures. TSMC posted its sixth consecutive quarter of record earnings, with net income rising nearly 69% on a 51% jump in revenue, alongside current-quarter revenue guidance beating consensus at up to $54.3 billion.

Holding a Leveraged ETF Overnight Can Cost You
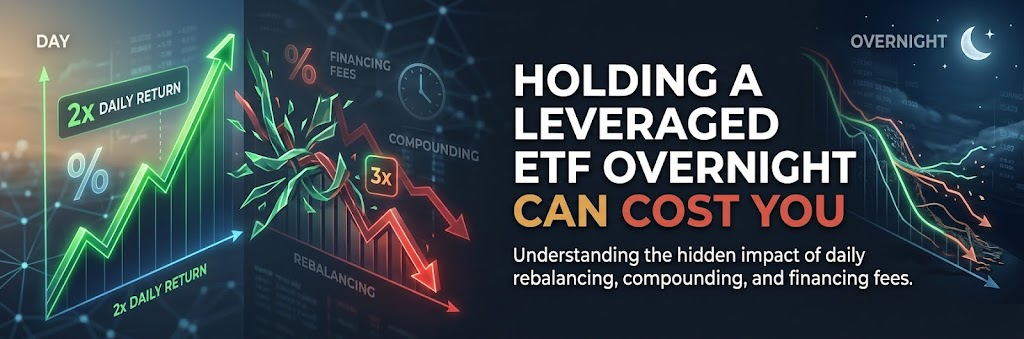
Leveraged ETFs can make market moves feel twice as exciting. If an index rises 1%, a fund targeting twice its daily return aims to gain about 2%. But holding that position overnight comes with costs traders often overlook.
These funds may use borrowing and derivatives to achieve their daily targets. Financing costs and fund expenses can eat into returns, while daily rebalancing and compounding can cause performance over several days to differ significantly from twice the index's return.
Imagine holding a 2x leveraged ETF for a week because you expect the market to keep climbing. Even if you're right about the overall direction, your returns may disappoint because of volatility and the fund's ongoing costs.
This doesn't mean you should never hold leveraged ETFs overnight. It means you need to understand what you're holding. Check the fund's expenses, daily objective, and risks before deciding how long to keep your position open.
Leverage can amplify gains, but holding longer doesn't guarantee better returns.
Understanding a fund's costs and daily behavior can help you avoid surprises after entering a trade.
Explore more market newsletters here

Doji
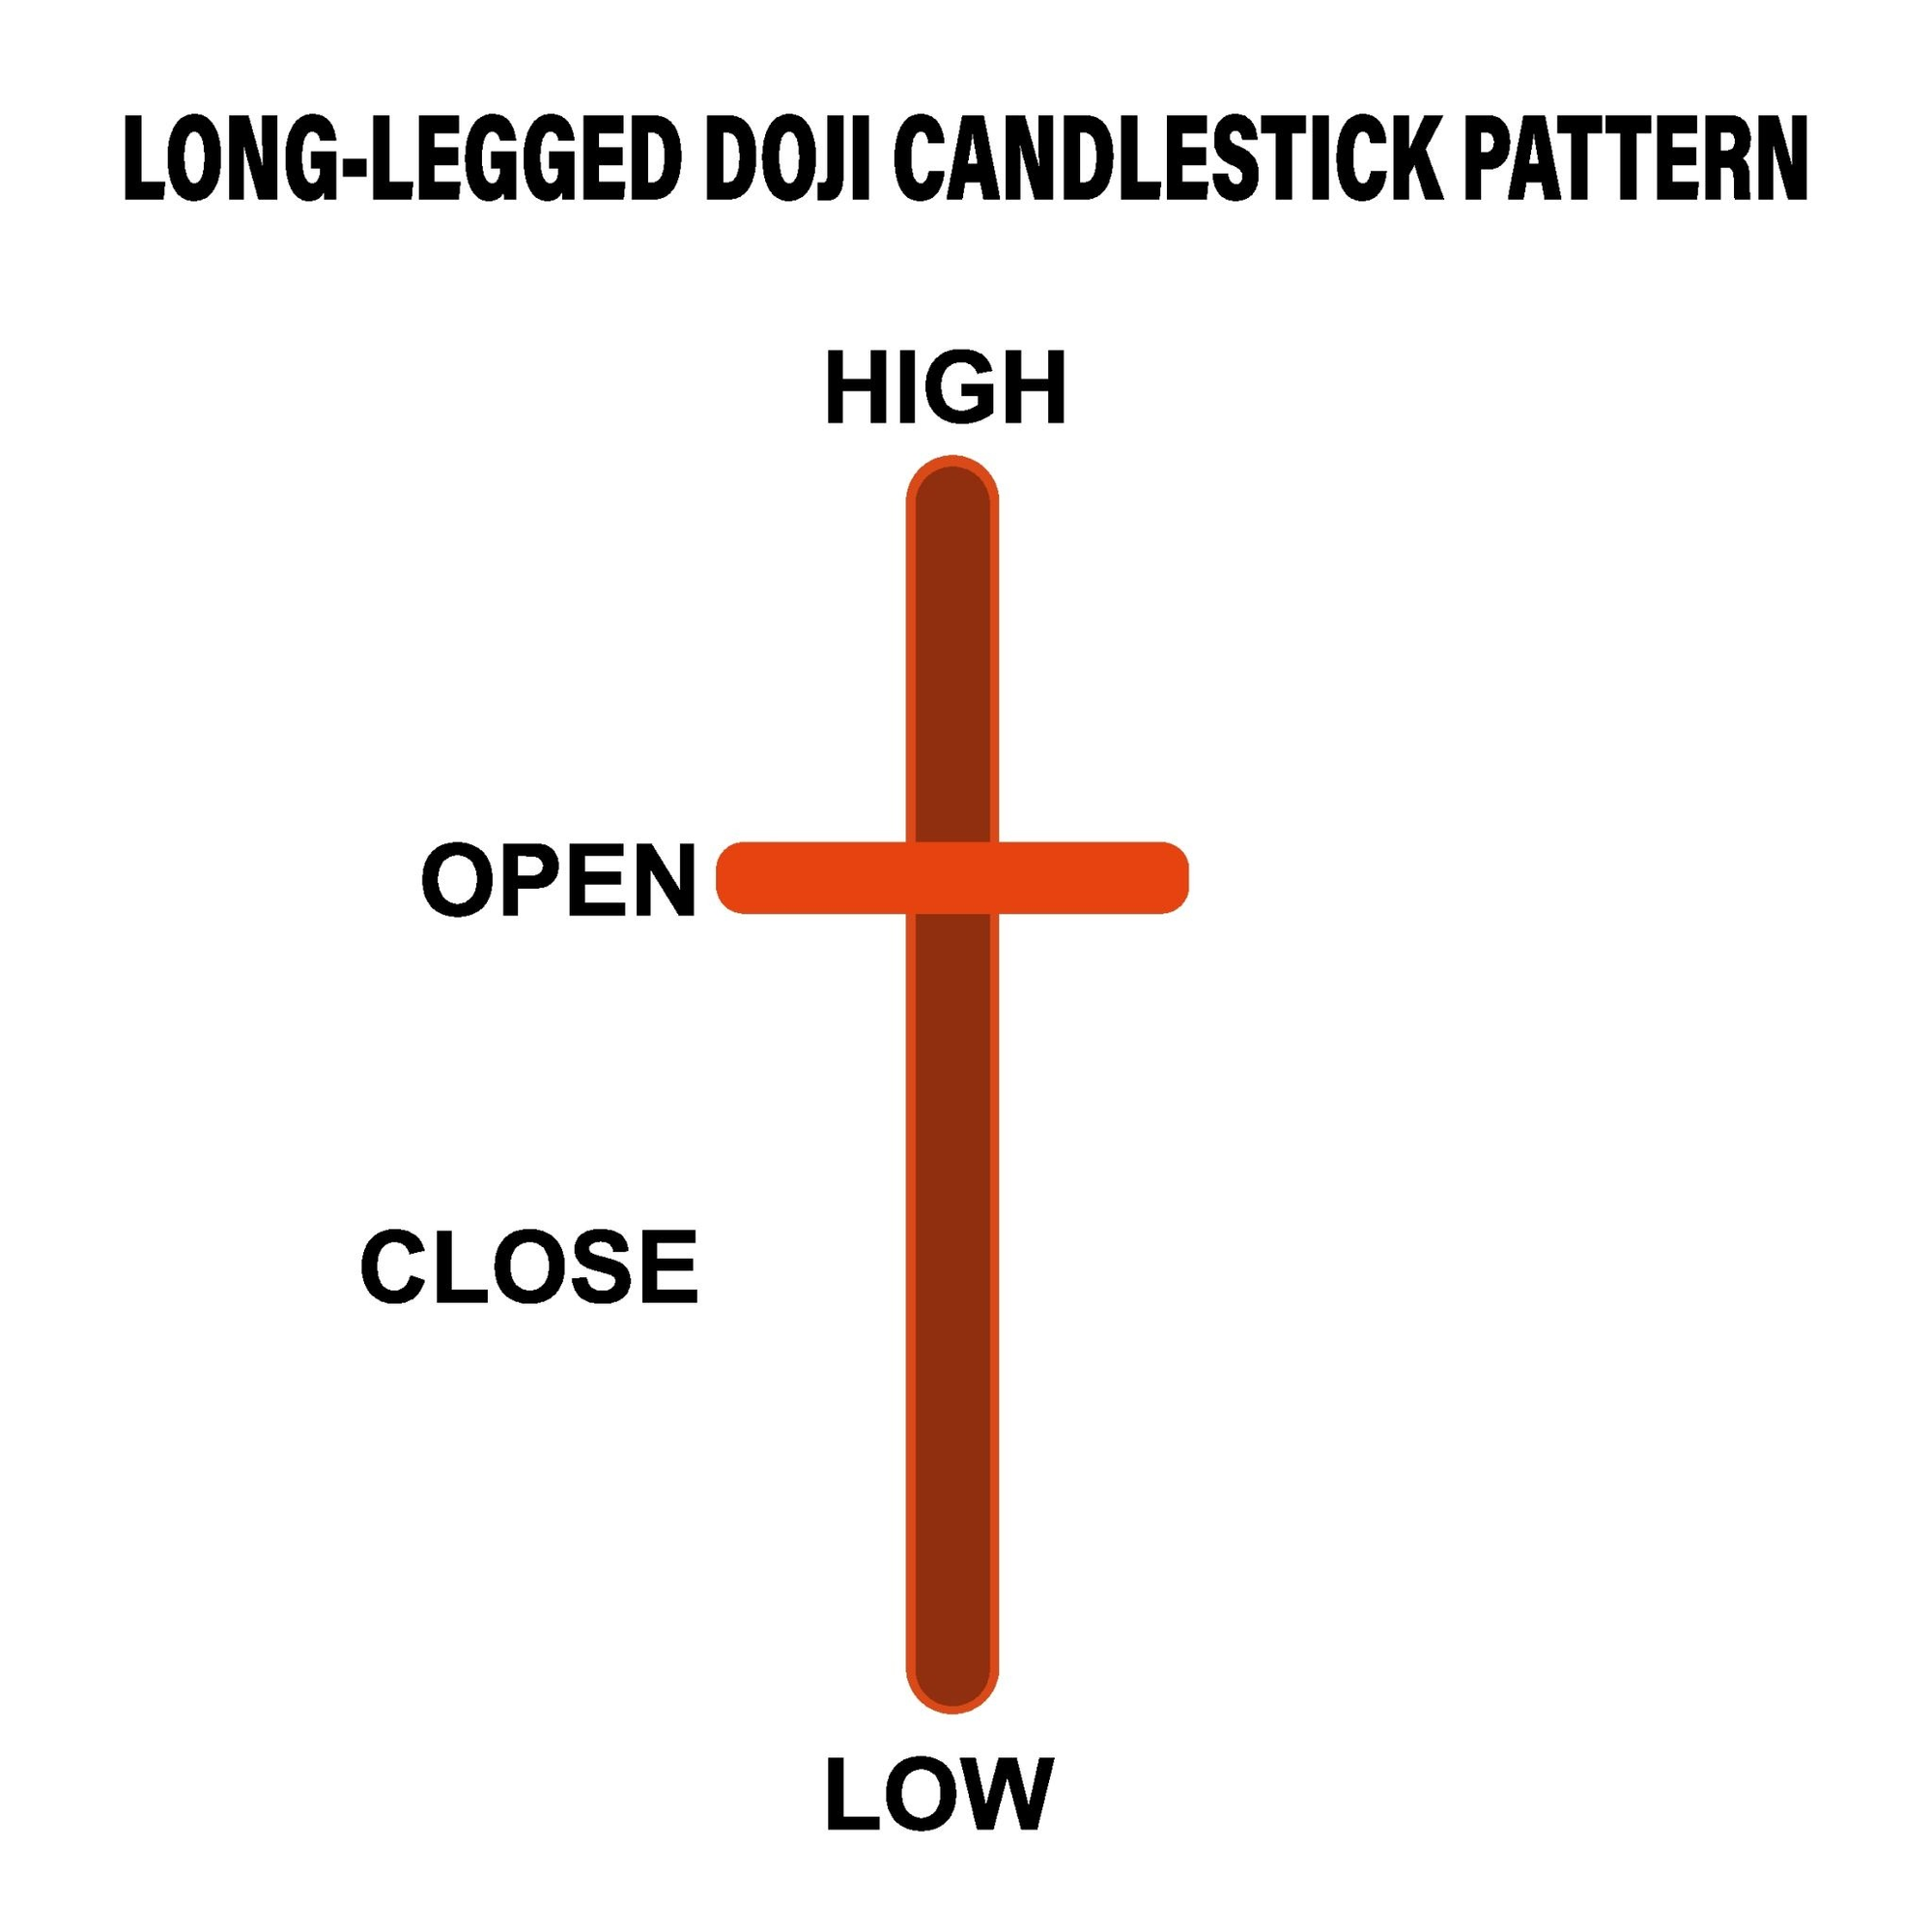
The Doji is a foundational single-candle pattern representing absolute equilibrium and indecision between buyers and sellers. It forms when the opening and closing prices for the session are virtually identical, leaving a razor-thin horizontal line rather than a recognizable real body. While buyers may push price significantly higher and sellers may drive it significantly lower during the session, neither side can maintain control by the closing bell. Appearing at key support or resistance levels, a Doji warns that the prevailing trend has run out of momentum and a decisive turning point is imminent.
🔴 The Red Zone (Trading Blindly on the Doji Print)
The Meaning: A Doji prints on the chart after an extended rally or sell-off. The session has ended in a deadlock.
The Move: Do not enter a trade on the Doji itself. A Doji reflects indecision, not a guaranteed reversal. Entering prematurely exposes you to severe whipsaw risk if the market merely pauses before continuing its original trend.
🟡 The Yellow Zone (The Stalemate at Key Boundaries)
The Meaning: The Doji forms directly against a major technical level—such as a horizontal support/resistance zone, a dynamic moving average, or an overbought/oversold oscillator band.
The Move: Watch closely and prepare your plan. The existing trend has officially hit a brick wall and paused. Tighten trailing stop-losses on existing trend positions and mark the absolute high and low of the Doji candle as your breakout trigger levels.
🟢 The Green Zone (The Confirmation Candle Close)
The Meaning: The candle immediately following the Doji breaks and closes decisively beyond the high (for a bullish reversal) or beyond the low (for a bearish reversal) of the Doji.
The Move: Go! The confirmation candle resolves the stalemate and reveals which side won the war. Enter in the direction of the break, placing your protective stop-loss just on the opposite side of the Doji’s wicks.
🔍 Two Simple Signals to Watch
1. Anatomy Matters: Dragonfly, Gravestone, and Long-Legged Dojis
Where the horizontal body sits along the vertical shadow reveals which side is actively losing ground:
- Dragonfly Doji (Bullish Lean): Open and close are at the very top of the candle with a long lower shadow. Sellers mounted an aggressive dump, but buyers completely erased it by the close. At a downtrend low, this carries heavy bullish reversal weight.
- Gravestone Doji (Bearish Lean): Open and close sit at the very bottom with a tall upper shadow. Buyers drove price to new highs, but sellers rejected them completely back to baseline. At the peak of an uptrend, this signals exhaustion.
- Long-Legged Doji (Maximum Volatility): Massive wicks in both directions with the body dead in the center, reflecting extreme intraday turbulence ending in an exact draw.
2. High-Volume Exhaustion at the Turning Point
Pay attention to the volume bar accompanying the Doji session.
- The Logic: A Doji on unusually heavy volume indicates an enormous turnover of shares between institutions—buyers and sellers threw everything they had at each other, yet neither could budge the close. When high volume produces zero net price progress, the prevailing momentum is exhausted, paving the way for a sharp reversal on the next candle.
💡 The Simple Secret
Think of the Doji as a high-stakes tug-of-war where both teams pull with all their might, but the rope doesn’t move an inch. After minutes of exhausting effort with no ground gained, both sides are gassed. The moment a fresh substitute steps in on the very next round (the confirmation candle) and pulls in one direction, the tired opposing team collapses immediately, sparking an explosive move.

That Ticker Doesn't Owe You Anything
There’s a stock you’ll never forget.

Maybe you caught a beautiful breakout on it once and made more money in a single trade than you usually make in a week.
Maybe you bought the dip when everyone was panicking, held your nerve, and watched the price fly.
Whatever happened, that ticker became special.
You remember the entry. You remember the profit. You probably remember exactly how you felt when you closed the trade.
And now, every time it starts moving again, your attention magically returns.
"Here we go again."
You open the chart. Start looking for an entry. Find a reason to get involved.
Except this time, the setup isn't particularly clean.
The trend is different. The market conditions have changed. Your usual confirmation isn't there.
But you keep looking.
Because somewhere in your head, this ticker has earned your trust.
You've mistaken a profitable memory for a present-day edge.
That's the Loyalty Trap.
It's surprisingly easy to become attached to a particular stock, currency pair, or crypto asset because of what it once did for you.
You start treating it like an old friend.
You know its personality. You've made money together. Surely, given enough time, it'll give you another opportunity?
Here's the problem: the market isn't your friend.
It doesn't remember the trade that paid your rent three months ago. It doesn't know you held through a brutal drawdown and came out profitable. It isn't preparing a special opportunity to reward your loyalty.
And it certainly doesn't care that you've been watching it for six hours.
Your history with an asset is not a reason to trade it today.
Imagine two charts sitting in front of you.
One belongs to the ticker you've made money on before. The other belongs to an asset you've barely traded.
The unfamiliar chart has the cleaner structure, clearer entry, and better-defined risk.
But you keep staring at your favourite.
Why?
Because the familiar one feels safer.
You've seen it work before, so your brain gives it the benefit of the doubt. Meanwhile, the better opportunity gets ignored because it doesn't come with a profitable memory attached.
That's how familiarity quietly overrides objectivity.
And sometimes, loyalty becomes even more expensive after a loss.
You lose money on your favourite ticker and immediately want another entry.
Not necessarily because the setup is good, but because you want to make things right.
You start treating the next trade like unfinished business.
But a new trade isn't an apology for the last one.
So here's a simple test.
Before entering your next trade on a familiar asset, pretend you've never traded it before.
Forget the big win. Forget the painful loss. Forget the hours you've spent studying it.
Look at the chart as if it's completely new to you.
Would you take this setup based on your rules alone?
If the answer is no, your attachment might be doing the analysis for you.
Keep trading the assets you know well if they genuinely suit your strategy. Familiarity can be useful when it comes from experience, tested patterns, and a clear understanding of how an asset behaves.
Just don't confuse that knowledge with loyalty.
You don't need to abandon your favourite ticker.
You need to stop giving it special treatment.
Trade the opportunity in front of you, not the memory of the one that made you money.
Because the market doesn't owe you another winning trade.
And the sooner you stop expecting it to repay your history, the sooner you can start evaluating what's actually happening today.