ASML Surges on Earnings
....................................................................................................................


Good morning, traders!
Stocks want to bounce back, chipmakers have something to prove, and inflation is about to walk into the room and change the mood.
US stock futures are edging higher this Wednesday, with Dow and S&P 500 futures up 0.1%. Nasdaq-100 futures are hovering just above flat after Tuesday's losses.
First, the big question: Is inflation heating up again?
September's Consumer Price Index report is due today, and economists expect headline inflation to reach 3.6% year over year, partly driven by higher gas and energy prices. With Brent crude still above $105 a barrel, there's little room for complacency. A hotter-than-expected reading could revive concerns about an October Fed rate hike.
Then there's the AI trade. Chip stocks are trying to recover after a rough stretch in South Korea. Investors will be watching ASML's results today and Taiwan Semiconductor's update on Thursday for clues about whether demand for AI infrastructure is still strong.
Meanwhile, Bank of America, Morgan Stanley, and BlackRock are reporting earnings as financial companies take their turn in the spotlight. Early bank results have offered encouraging signs about consumer resilience, even with borrowing costs elevated.
So, today's market has three tests: inflation, AI demand, and corporate earnings.
Stocks may be edging higher before the opening bell, but the CPI report could decide whether that optimism lasts.

📈 Global Stocks Steady as Chipmakers Rebound Ahead of U.S. Inflation Data
World equity benchmarks found stability on Wednesday, with Europe's Stoxx 600 gaining 0.4% and the MSCI All-World index edging up 0.1%. A modest recovery across semiconductor shares helped offset broader macro caution as global trading desks positioned ahead of key U.S. consumer price index data.
🛢️ Oil Trades Choppy Near $105 Following IEA Warning and Aramco Strike Reports
Crude prices fluctuated Wednesday morning after overnight gains of more than 1%, with Brent holding near $105.66 a barrel and WTI trading flat at $94.20. Market participants weighed the International Energy Agency's monthly outlook warning of supply constraints against fresh reports from Saudi officials concerning drone attacks targeting Aramco energy installations.
🌏 Asian Equities Slide Following ASML Remarks and AI Spending Caution
Asia-Pacific stock markets broadly retreated Wednesday, struggling to recover from the previous session's steep technology selloff. Sentiment across the regional chip sector remained dented by cautious forward comments from Dutch equipment giant ASML, rising competition from Chinese domestic silicon designers, and warnings comparing enterprise AI infrastructure buying to speculative gambling.
📺 Netflix Slips Overnight as Analysts Flag Margin Squeeze Ahead of Q3 Print
Netflix (NFLX) shares edged down overnight heading into Wednesday after Huber Research downgraded the streaming pioneer to Underweight and KeyBanc trimmed its price target. Analysts pointed to accelerating content expenditures, plateauing subscriber margins, and competitive viewership pressures ahead of the company's upcoming earnings release.
📉 KeyBanc Urges Netflix to Present Clear Turnaround Strategy as Shares Fall 25%
With Netflix shares down 25% year-to-date and steadily declining since mid-April, KeyBanc highlighted four pivotal strategic pivots management must articulate during its October 20 earnings call. Analysts warned that intensifying market-share competition from YouTube and live sports expansion on Amazon Prime have compounded headwinds from a soft slate of original programming.
🥇 Gold Holds Steady Near Recent Lows as Fed Official Signals Rate Peak
Spot gold steadied following a two-day retreat after Federal Reserve commentary suggested that while one final interest rate hike may be warranted before year-end, further monetary tightening will likely pause in 2027. The measured policy outlook helped anchor bullion prices and temper aggressive rate-hike discounting across precious metal desks.
🥉 Copper Climbs to Three-Week High on Mine Supply Risks and Fed Signals
Benchmark copper futures advanced to a three-week peak on Wednesday, supported by emerging labor strike threats across major Latin American extraction sites. The industrial metal also drew upside momentum from softer rate expectations following dovish medium-term commentary from Federal Reserve officials.

Your Broker's Incentives May Not Be What You Think

You place a trade.
You see the price, click buy, and expect your order to be filled. It feels like a simple transaction.
But there's more happening behind the scenes.
Markets need buyers and sellers to trade efficiently. Market makers help provide that liquidity by quoting prices at which they're willing to buy and sell. They generally aim to earn money from the bid-ask spread while managing the risk of holding positions.
Some firms also receive retail order flow and may earn revenue from routing those orders, depending on the market and the business model involved.
So where does that leave you as a retail trader?
It means you should understand how your orders are handled and what costs or incentives may affect execution.
For example, a market maker may offer a tight spread but still face conditions where prices move before your order is filled. In less liquid markets, the spread may widen. Your final execution can also depend on order type, market conditions, and the venue handling the trade.
But don't jump to the conclusion that market makers always trade against you or deliberately cause your losses. Their role, incentives, and obligations vary across markets and jurisdictions.
The important point is that your order doesn't exist in isolation. It moves through a market structure with its own participants, costs, and incentives.
Learn how your broker routes orders. Understand the difference between market and limit orders. Review your fills, spreads, and slippage over time.
You don't need to know every detail of market microstructure to trade well.
But understanding who handles your orders — and how they make money — can help you ask better questions about execution.
The more you understand how your trades are processed, the less you have to rely on assumptions.
Trading involves more than reading charts. Understanding market structure, liquidity, and execution can help you see what happens between clicking a button and getting a fill.
Explore more market newsletters here:

Aroon Indicator
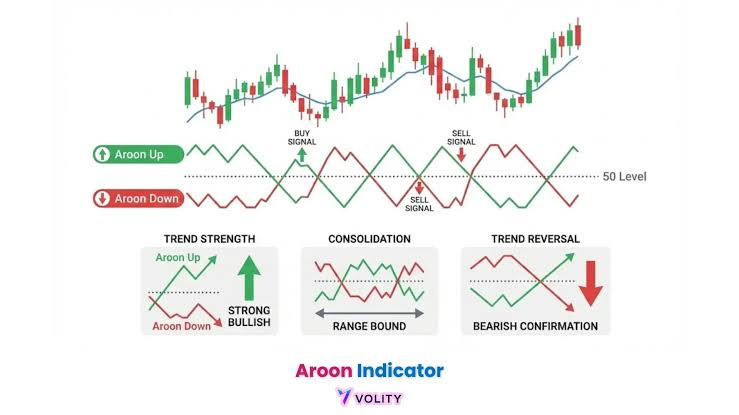
Aroon Indicator Trend Strength, Crossovers, and Consolidation Phases. Source: Volity
Developed by Tushar Chande in 1995 (named from the Sanskrit word Aroon, meaning "dawn's early light"), the Aroon Indicator measures whether a market is trending, how strong that trend is, and when a new trend is about to emerge. Unlike standard momentum oscillators that track price levels or changes in volume, Aroon measures time relative to price—specifically, how many periods have elapsed since price printed its highest high or lowest low over a lookback window (typically 25 periods). It plots two lines bounded between 0 and 100: Aroon Up and Aroon Down.
🔴 The Red Zone (Aroon Down Above 70 / Aroon Up Below 30)
- The Meaning: The Aroon Down line surges above 70 while the Aroon Up line drops beneath 30. The market is making new lows very frequently, while new highs have become distant memories.
- The Move: Protect capital. Downward momentum is dominant and institutional selling is active. Avoid dip-buying or entering long trades; focus on trailing stops on short positions or remaining in cash.
🟡 The Yellow Zone (Parallel Lines / Hovering Between 30 and 70)
- The Meaning: Both Aroon Up and Aroon Down are moving horizontally, trading parallel to each other, or fluctuating within the neutral 30 to 70 range without either line crossing the 50 centerline.
- The Move: Hold and wait. The market is stuck in choppy consolidation or a trading range. Neither buyers nor sellers have registered a recent structural peak or trough. Avoid trend-following breakout entries until one line breaks free above 70.
🟢 The Green Zone (Aroon Up Above 70 / Aroon Down Below 30)
- The Meaning: The Aroon Up line pins above 70 (often touching 100) while the Aroon Down line is suppressed below 30. Price has printed fresh highs recently, confirming a strong, persistent bull trend.
- The Move: Go! A sustained reading of Aroon Up above 70 is your green light to ride long trends with confidence, using the 50 centerline as a dynamic trend-continuation threshold.
🔍 Two Simple Signals to Watch
1. The Dawn of Trend Crossover (50-Line Filter)
The primary reversal trigger occurs when the two lines cross, but filtering by the 50 midpoint weeds out consolidation noise.
- Bullish Crossover: Look for Aroon Up to cross above Aroon Down. The signal is confirmed when Aroon Up continues through the 50 level toward 70 while Aroon Down slides under 50, marking the inception of a fresh uptrend.
- Bearish Crossover: When Aroon Down crosses above Aroon Up and punches above 50 while Aroon Up drops below 50, a confirmed downtrend is underway.
2. The 100-Pin & Divergence Warning
Track how often each line hits and holds the absolute extreme of 100.
- The Logic: When a line hits 100, price just printed a brand-new 25-period extreme on the current bar. If Aroon Up repeatedly hugs 100, the trend is exceptionally strong. If the price continues edging slightly higher but Aroon Up fails to touch 100 and begins slipping below 70, the trend is aging—the rate of printing new highs is slowing down, signaling an impending top.
💡 The Simple Secret
Think of the Aroon Indicator as a "Days Since Last Accident" sign on a factory floor. Instead of measuring how severe an accident was (price change), it simply counts how recently it happened. If the "Days Since Last High" sign says 0 days (Aroon Up at 100), the bulls are actively on site right now. If it has been weeks since anyone saw a new high, Aroon Up sinks to 0—warning you that the bulls have completely clocked out and left the building.

You Don't Want a Trade. You Want a Rush
Imagine two traders sitting in front of their screens.
The first has been watching a clean setup develop for 40 minutes. Price is approaching his level, his conditions are lining up, and he knows exactly what he's waiting for.
The second has three charts open, a news feed running, and one eye on a coin that's suddenly moving 8% in ten minutes.
Guess who's having more fun?
Probably the second guy.
Guess who's more likely to start taking trades that weren't in the plan?
You know the answer.
Here's something uncomfortable to admit: you can genuinely want to become a consistent trader while secretly hating what consistency requires.
You want steady profits. You want discipline. You want fewer mistakes.
But you also want the excitement.
The heart-racing breakout. The sudden spike. The feeling that something BIG is about to happen and you need to be part of it.
A quiet market doesn't give you that feeling. Neither does waiting patiently for one clean setup.
So you start looking for entertainment.
You switch to a faster chart. Chase a volatile asset. Enter a trade that's almost valid because watching price move without you feels unbearable.
And just like that, your trading account becomes the price of admission to your own personal action movie.
Except the explosions are happening in your balance.
The problem isn't that you enjoy excitement. It's when excitement becomes your reason for trading.
That's when you'll struggle to leave a quiet market alone. You'll interpret movement as opportunity and boredom as a reason to act.
Even a good day can feel disappointing if you only took one trade, because part of you wanted more than profit.
You wanted the feeling of trading.
And that feeling can be expensive.
There's a useful test for this.
Think about your best trading days. Were they the days you felt the most excited, or the days you followed your plan most consistently?
Now think about your worst days. How many began with you feeling bored, restless, or desperate for something to happen?
Your answers might reveal a pattern worth taking seriously.
Because the goal isn't to eliminate every emotion. It's to stop using trades to manufacture them.
Try this the next time the market feels painfully quiet: don't open another chart just to find action. Give your existing setup time to develop. If nothing qualifies, let nothing happen.
You don't need to fill every silent moment with a position.
And if you find yourself repeatedly forcing trades because you miss the rush, be honest about that too. Build rules that limit impulsive entries, step away when restlessness takes over, and pay attention to what your journal says about those trades.
Learn to separate the pleasure of trading from the quality of the trade.
A quiet setup can be excellent. A thrilling setup can be terrible. The market doesn't award bonus points for making your pulse race.
Sometimes the best trading day is almost embarrassingly uneventful.
One good decision. A controlled risk. Then you close the laptop and get on with your life.
No dramatic screenshot. No war story for the group chat.
Just a job well done.
And if that sounds boring, perhaps that's the part of trading you need to practise most.
You came to the market to build consistency, not to buy a daily dose of adrenaline.