Nike Stock Sinks Deep Red
....................................................................................................................


Good morning, traders.
The market has a number to obsess over today: 85,000.
That’s the number economists expect the US economy to have added in September. And after August delivered a much stronger jobs report than expected, Wall Street is waiting to see whether hiring has finally settled into something closer to normal.
Futures are starting the day in positive territory. Dow and S&P 500 futures are up about 0.3%, while Nasdaq-100 futures are ahead 0.6%.
But here's where it gets interesting.
A softer jobs number could reinforce the idea that the economy is cooling. A surprisingly strong one could keep the Fed's rate-hike conversation alive. Traders have already pulled back expectations for an October move, but a December hike remains firmly on the table.
And hanging over all of this is oil.
Brent crude is hovering around $102 a barrel as the Middle East conflict continues to complicate the inflation picture. So even if today's jobs report looks friendly, the Fed still has another problem sitting right beside it.
In other words, Wall Street isn't looking for a good jobs report.
It's looking for the kind of jobs report that doesn't create three new problems.

👟 Nike Sinks on Revenue Miss and Plans Fresh Headcount Reductions
Nike shares fell sharply in extended trading after quarterly revenue came in below Wall Street expectations across key North American and international direct-to-consumer channels. Management signaled plans to implement further corporate job cuts and restructure regional distribution units as part of an aggressive cost-reduction initiative to stabilize operating margins.
🛢️ Oil Plunges Over 3% as Strategic Stock Release Weighed; Brent Drops Below $100
Crude prices tumbled more than 3% on Friday, sending international benchmark Brent back below the psychological $100-per-barrel threshold. The sharp pullback followed reports that European governments and international partners are considering emergency releases of diesel and crude stockpiles to ease severe refining shortages and surging consumer fuel costs.
🌍 Global Equities Rebound as Sovereign Bond Selloff Eases Ahead of U.S. Jobs
World stock markets found firmer footing on Friday as the intense global bond rout paused and benchmark Treasury yields retreated from multi-decade highs. Easing fixed-income volatility and retreating energy prices helped calm risk sentiment, with trading desks steadying allocations just ahead of the high-stakes U.S. nonfarm payrolls report.
💾 Micron Advances Following Blowout Earnings and Robust HBM Guidance
Micron Technology climbed after reporting quarterly results that surpassed analyst consensus on both revenue and net earnings. The chipmaker provided upbeat forward guidance, citing insatiable hyperscaler demand for its high-bandwidth memory (HBM) and data center DRAM architecture through 2027.
🖥️ HPE Reaches Record High on $12B AMD Helios Networking Order
Hewlett Packard Enterprise shares finished at an all-time peak following a blowout $12 billion custom AI networking and system deployment pact centered on AMD's next-generation Helios architecture. The deal highlights accelerating enterprise demand for high-throughput enterprise hardware.
📊 Asian Shares Fall as Investors Brace for U.S. Nonfarm Payrolls
Equities in Tokyo, Seoul, and Sydney traded lower on Friday as global investors stood by for the high-stakes U.S. September jobs print. Elevated bond volatility and persistent expectations for further Federal Reserve policy tightening kept trading cautious across regional bourses.
🥇 Gold Consolidates Ahead of U.S. Jobs Data, Tracking Second Weekly Loss
Spot gold steadied during early European trading but remained on track to lock in its second consecutive weekly decline. Bullion continues to face headwinds from elevated benchmark Treasury yields and a resilient dollar ahead of key U.S. employment figures.

Don't Let Someone Else's Screenshot Set Your Benchmark
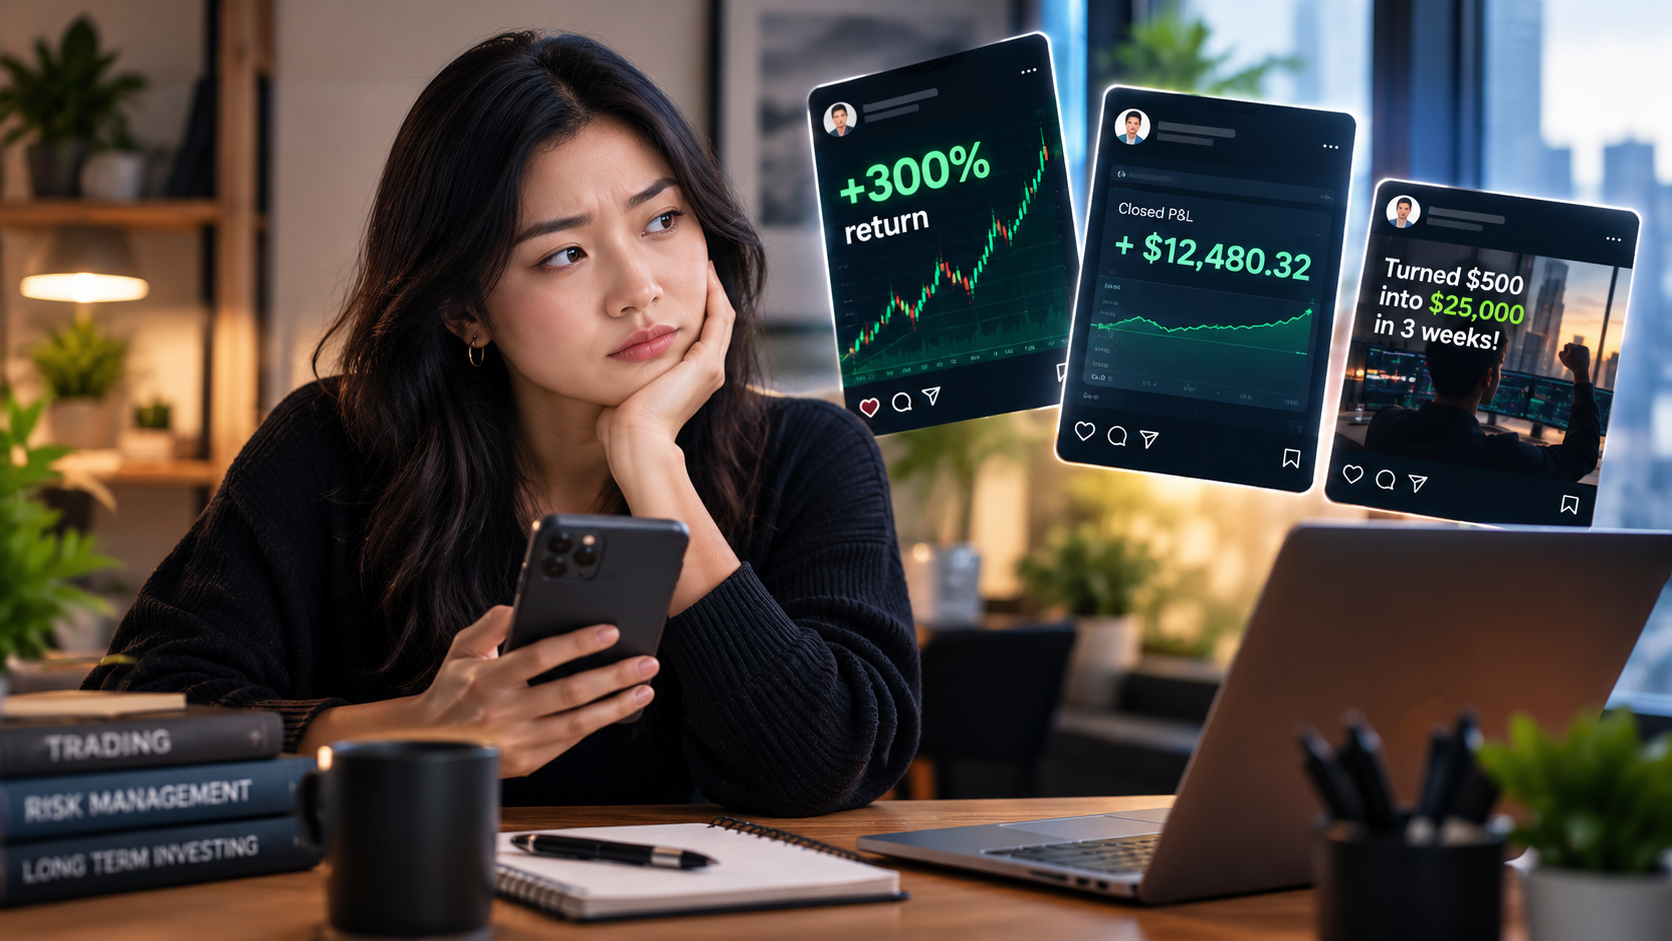
You open social media and see a trader posting a 300% return.
Another screenshot shows a huge winning trade.
Someone else claims they turned a small account into a much larger one in a matter of weeks.
It can make your own results feel disappointing.
But there's a problem.
You're comparing your full trading journey with someone else's highlight reel.
A screenshot rarely tells you the whole story.
You don't know the trader's starting capital, total number of trades, losing periods, leverage, risk per trade, or how much money was lost before or after the screenshot.
You also don't know whether the result was repeatable.
This can push traders into taking more risk just to match someone else's performance.
They increase position sizes. Take more trades. Use more leverage. Abandon their normal rules because their own returns suddenly don't seem good enough.
That's how someone else's screenshot can become your risk management problem.
Your benchmark should come from your own process.
Track your returns, drawdown, risk-adjusted performance, consistency, and whether you're following your rules.
A 10% return achieved while following a disciplined process can tell you more about your development than a 300% screenshot with no context.
Social media can show you what happened.
It rarely shows you everything that happened.
Don't measure your trading against someone's best screenshot. Measure it against your own process and objectives.
There is plenty of useful information on trading online, but context matters. Reading thoughtful market analysis can be more useful than chasing impressive screenshots.
Explore more market newsletters here:

The Hanging Man
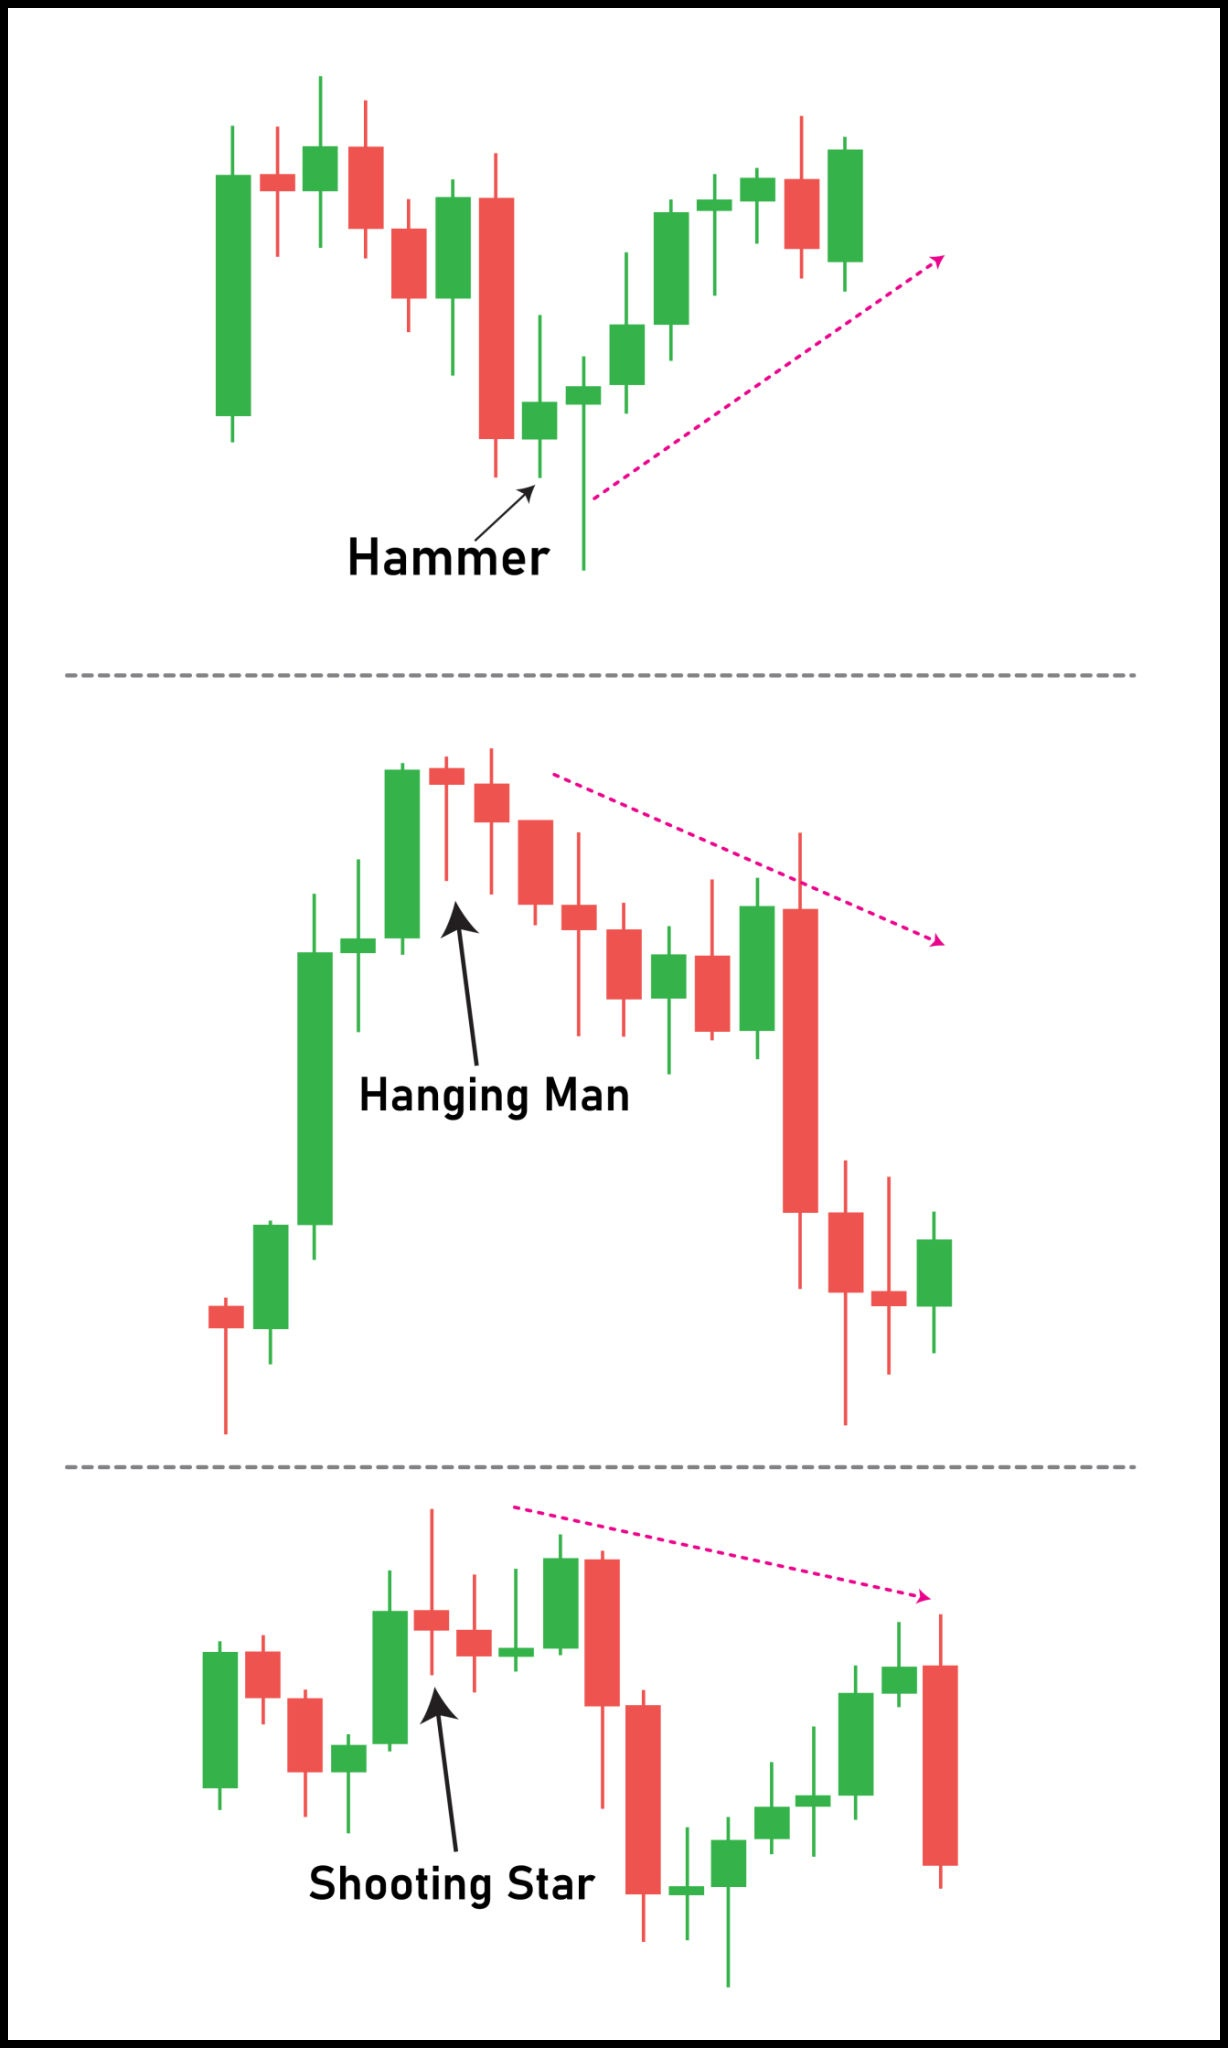
Hanging Man Candlestick Structure and Reversal Breakdown. Source: maliha majeed / Getty Images
The Hanging Man is a single-candle bearish reversal pattern that appears at the climax of an extended uptrend or corrective rally. Structurally identical in shape to the Hammer, it features a small real body positioned near the very top of the session's range, little to no upper shadow, and a long lower shadow that is at least two to three times the height of the real body. While the intraday bounce looks like buyer resilience on the surface, it actually reveals that severe selling pressure has breached the market's defenses for the first time in the uptrend.
🔴 The Red Zone (The Prior Uptrend & Intraday Sell-Off)
- The Meaning: The market is pushing into new highs within an established bull run. Suddenly, an aggressive wave of selling hits the tape, driving prices down into a deep intraday hole before buyers push it back toward the open.
- The Move: Stop chasing new long entries. Even though the price recovered before the close, the deep lower wick proves that buyers are no longer able to keep the market pinned at highs without facing significant institutional supply.
🟡 The Yellow Zone (The Hanging Man Print)
- The Meaning: The session closes with a small real body (red or green) and a long lower shadow hanging beneath it.
- The Move: Watch closely and prepare defensive measures. Tighten trailing stops on open long positions. A Hanging Man is a warning, not an automatic trigger—you must wait for the next candle to confirm that the bears are following through on that initial crack in support.
🟢 The Green Zone (The Confirmation Close)
- The Meaning: The candle immediately following the Hanging Man opens flat or gaps down, trading and closing decisively below the real body (or below the low) of the Hanging Man.
- The Move: Go! A confirmed close below the Hanging Man is your official green light to exit remaining long positions or initiate a short trade. Place your protective stop-loss just above the highest point of the pattern (the high wick of the Hanging Man).
🔍 Two Simple Signals to Watch
1. The Red Body Advantage & Gap Down
While the body can be green or red, candle color and opening gaps dictate pattern strength.
- The Logic: A red Hanging Man (close below open) is significantly more bearish than a green one because it shows sellers managed to push the price into negative territory by the close. If the subsequent confirmation candle gaps down below the Hanging Man’s real body, it leaves everyone who bought the intraday recovery trapped at a loss.
2. The Heavy Volume Dump on the Lower Wick
Pay close attention to the volume bar accompanying the Hanging Man.
- The Logic: If the Hanging Man prints on unusually high volume, it signals heavy institutional distribution. Market makers and large funds used the intraday dip to offload substantial inventory to late-retail buyers, setting the stage for a sharp downward break once support folds.
💡 The Simple Secret
Think of the Hanging Man as a crack appearing in a frozen lake. The ice still holds you today (the price bounced back to close near the top), but the deep plunge proves that the ice is dangerously thin underneath. You don't wait around for the ice to completely shatter—the moment the next step drops below that crack, you step off immediately before the entire floor gives way.

You’re Chasing the Feeling, Not the Trade
There’s a trader who sees a setup and immediately feels it.
Pulse goes up.
Chart starts moving.
He gets that little rush in his chest that says:
“Here we go.”
Click.
Now he’s in.
The trade moves a few points.
He feels brilliant.
It pulls back.
He gets nervous.
Then it moves again.
Now he’s fully locked in, staring at the screen like the market owes him a Netflix finale.
That's the dopamine setup.
You’re not necessarily trading because the opportunity is great.
You’re trading because being in a trade feels exciting.
And the market gives you plenty of ways to feed that feeling.
A breakout.
A big candle.
News hitting.
A fast move.
A chart lighting up with arrows and colours.
Anything that creates the sensation that something is happening.
The problem is that excitement can slowly become your selection criteria.
You start choosing trades that are stimulating instead of trades that actually fit your process.
Quiet setup?
Boring.
Slow market?
Boring.
Clean level that may take an hour to trigger?
Very boring.
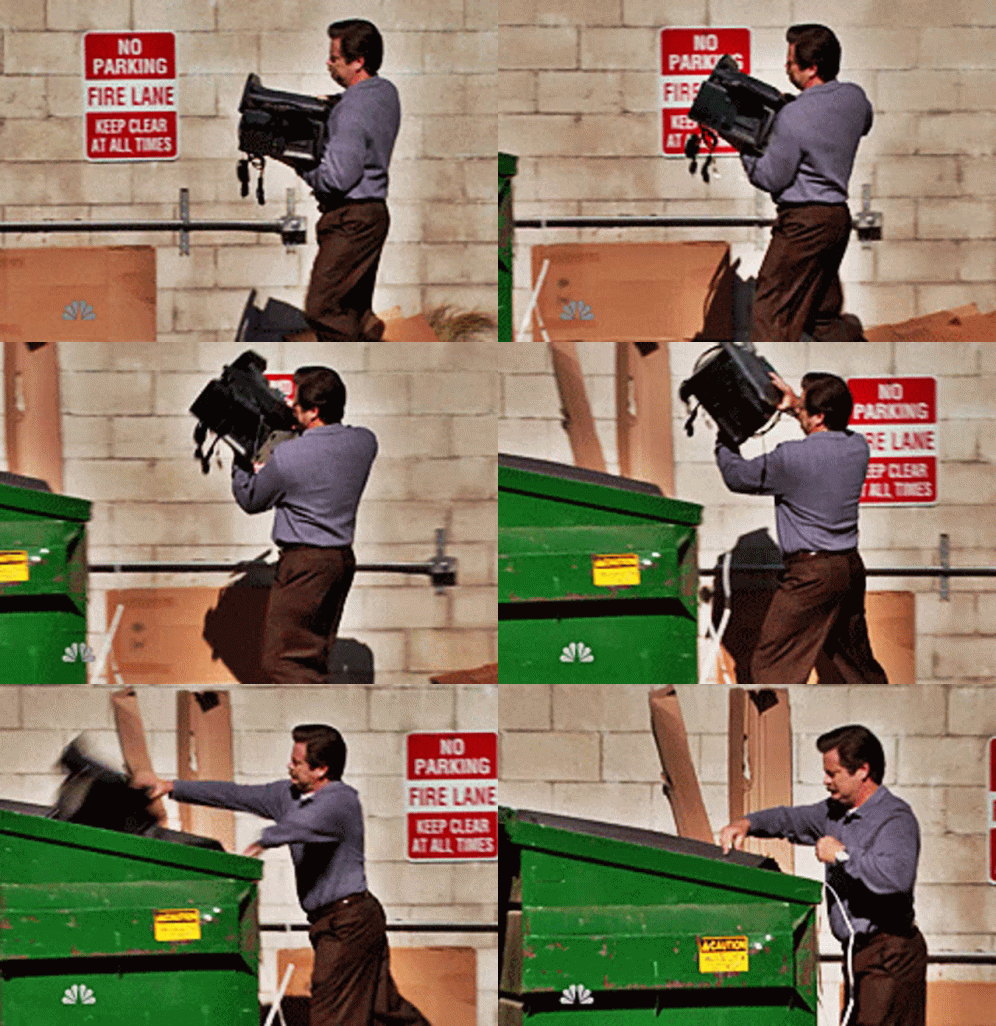
But give you a fast-moving chart with a giant candle and suddenly you're wide awake.
That's how people end up trading markets they don't even understand.
They weren't looking for an edge.
They were looking for stimulation.
And here's the ugly part:
Dopamine doesn't care whether the trade is good.
It just wants another hit.
So one trade ends...
You look for another.
Then another.
Eventually you're taking trades simply because you haven't had that feeling in a while.
That's when overtrading becomes almost automatic.
The market becomes entertainment.
And once that happens, patience feels like punishment.
A trader can actually become uncomfortable when nothing is happening.
Think about how backwards that is.
Your best trading day might involve sitting for three hours, taking one clean setup and walking away.
Your brain, meanwhile, is asking:
"That's it? We did all this for ONE trade?"
Exactly.
That's it.
Because the goal isn't to feel busy.
It's to make good decisions.
So here's a useful test for your next setup:
Before entering, ask:
"If this trade took three hours to reach the target and felt completely boring, would I still want it?"
If the answer is no...
You may not want the trade.
You may want the feeling.
And those are two very different things.
Good trading can be exciting sometimes.
But if you need excitement to stay engaged, eventually you'll start creating opportunities that aren't really there.
The market doesn't know you're bored.
It doesn't care that you haven't traded all morning.
It certainly doesn't owe you a little adrenaline before lunch.
Your edge might be sitting quietly in front of you.
No fireworks.
No drama.
Just a clean setup.
And sometimes the most profitable thing you can learn is that boring is not the absence of opportunity.
Boring is often what good execution feels like.