Nvidia Stock Surge Over 8%
....................................................................................................................


TGIF Friday!
And the market has one question this morning:
What is Kevin Warsh going to say?
US stock futures are mostly holding steady ahead of the Federal Reserve’s Jackson Hole Symposium, where Fed Chair Kevin Warsh is scheduled to speak. The Dow and S&P 500 are roughly flat, while Nasdaq futures are slipping after a strong rally in tech stocks yesterday.
Now, traders are listening closely.
Warsh’s recent comments left investors trying to figure out where the Fed is headed on interest rates. With inflation still above the central bank’s target and Fed officials divided over what comes next, his speech could provide some much-needed clarity.
Bond yields are also sitting near recent highs, showing that investors remain concerned about inflation and government debt.
Meanwhile, Nvidia’s bullish outlook has given the AI trade another boost, helping tech stocks rally this week.
So Friday’s setup is pretty simple.
The market isn’t doing much yet.
Everyone is waiting for Warsh to open his mouth.
Because sometimes, in markets, one speech can move more money than a whole week of trading.

🚀 Nvidia Adds $442B in Second-Largest Stock Surge in History
Nvidia (NVDA) surged 8.7% on Thursday, adding $442 billion to its market capitalization in the second-largest single-day market value gain in financial history. The rally pushed the chipmaker's total enterprise valuation to roughly $5.5 trillion, cementing its standing as the world's most valuable company.
💵 Dollar Holds Firm Ahead of Warsh's Jackson Hole Debut
The U.S. dollar held near a one-week high on Friday as currency markets positioned ahead of Federal Reserve Chairman Kevin Warsh’s keynote address at Jackson Hole. Sticky inflation above 2% has prompted money markets to price in at least one 25-basis-point interest rate hike later this year.
🥇 Gold Holds Near $4,600 on Track for Historic Monthly Gain
Spot gold steadied near $4,600 an ounce as traders weighed the path of Fed interest rates and currency debasement pressures following recent Treasury bond buybacks. The precious metal remains on track to book its largest monthly percentage gain since 1999.
⚔️ Markets Adapt to Middle East Stalemate Six Months Into War
Global financial markets marked six months since the onset of major U.S. and Israeli combat operations in Iran, with trading desks adjusting to ongoing regional shipping disruptions and prolonged military stalemate across the Persian Gulf.
🍦 Mixue Slides 7% in Hong Kong as Rising Costs Squeeze Profits
Shares of Chinese beverage and ice cream chain Mixue dropped over 7% in Hong Kong, extending a multi-day slide. The sell-off followed the company's first-half financial report, which revealed contracting net profit margins driven by rising operational overhead and higher ingredient costs.
👕 Gap Surges 12% After Naming New Old Navy CEO
Gap Inc. shares rallied 12% following the announcement that Michael Francis will step in as the new CEO of Old Navy effective November 2. The executive leadership change aims to turnaround sluggish sales growth and revitalize the flagship retail brand.
🌏 Asian Bourses Turn Cautious as Markets Await Fed Policy Signals
Asia-Pacific equities paused following an initial Nvidia-led tech rally, with MSCI’s regional index up 0.2% and Japan’s Nikkei adding 0.5%. Global bond and foreign exchange markets remained largely rangebound as institutional desks awaited Chairman Warsh's policy guidance from Wyoming.

A Strategy Isn't Proven Until It Survives the Worst Conditions
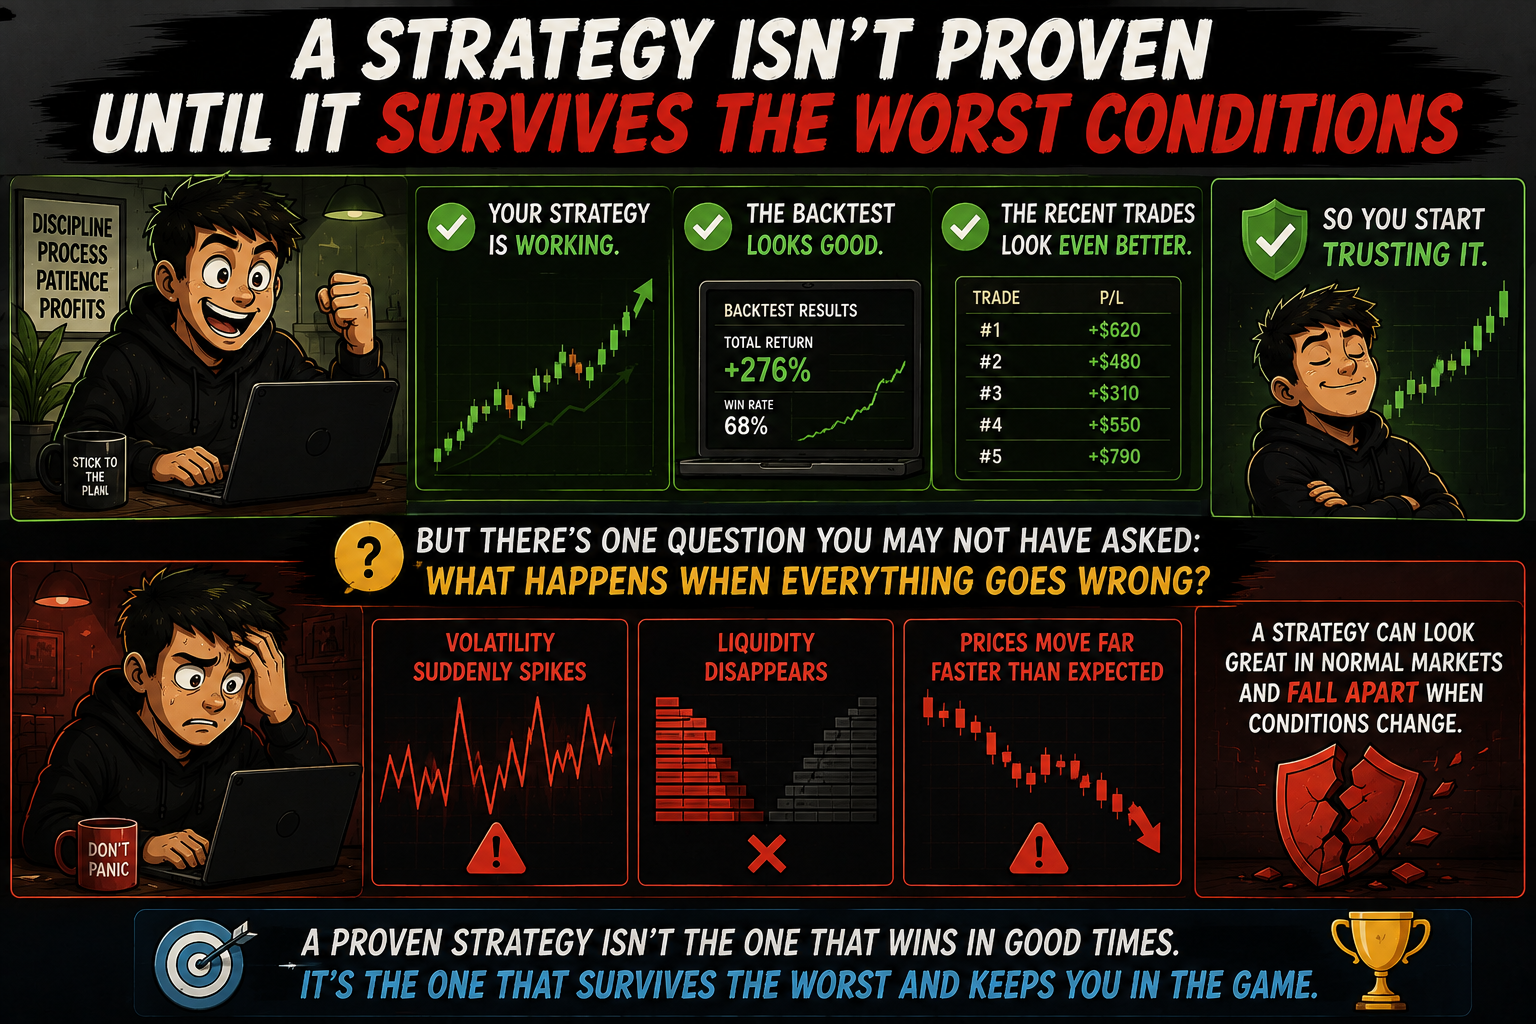
Your strategy is working.
The backtest looks good. The recent trades look even better. So you start trusting it.
But there's one question you may not have asked:
What happens when everything goes wrong?
A strategy can look great in normal markets and fall apart when volatility suddenly spikes, liquidity disappears, or prices move far faster than expected.
That's why stress-testing matters.
Many traders test how much money a strategy can make. They don't spend enough time testing how badly it can lose.
Strong traders do both.
They ask what happens during sharp sell-offs, unexpected gaps, extreme volatility, wider spreads, and long losing streaks. They test whether their position sizing and risk controls can handle conditions that aren't comfortable.
Because you don't really know how robust a strategy is until you see how it behaves under pressure.
The goal isn't to make your strategy survive every possible scenario.
It's to find out where it breaks before the market does it for you.
A strategy that looks good in calm markets is promising.
A strategy that has survived serious stress is much more trustworthy.
Good trading isn't just about finding strategies that work. It's about understanding where they can fail and preparing before those conditions arrive.
If you'd like to explore more thoughtful market perspectives, you can discover a few market newsletters here:

Hull Moving Average (HMA)
Developed by Alan Hull, the Hull Moving Average (HMA) solves the biggest flaw in traditional moving averages: lag. By using weighted moving averages (WMAs) nested within square-root periods, the HMA dramatically reduces delay while maintaining a remarkably smooth curve. It hugs price action closely, providing ultra-responsive trend direction and turning-point signals without the erratic whipsaws of raw price noise.
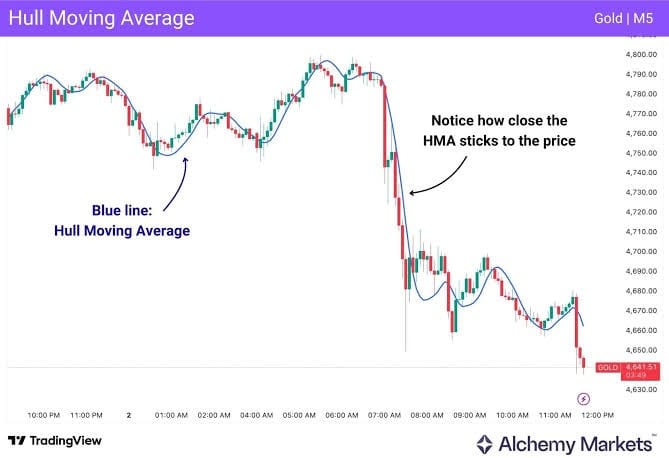
Hull Moving Average (HMA) Responsiveness and Trend Tracking. Source: Alchemy Markets
🔴 The Red Zone (HMA Sloping Down / Price Below Line)
The Meaning: The HMA curve turns downward and price trades below the line (often color-coded red on modern charting platforms). This indicates active downward momentum where recent price depreciation is heavily weighted. The Move: Protect capital. Exit long positions or look for short opportunities. Because the HMA turns rapidly, a downward curl is an early warning that the current rally has exhausted its momentum.
🟡 The Yellow Zone (The Flattening Inflection Point)
The Meaning: The HMA line levels off flat as price action consolidates or crosses through the moving average line. The Move: Hold and wait. The market is transitioning between directional pushes. A flat HMA indicates a lack of decisive trend velocity—wait for the slope to definitively tilt before opening new trend-following positions.
🟢 The Green Zone (HMA Sloping Up / Price Above Line)
The Meaning: The HMA curves upward and price holds above the line (often color-coded green). This confirms that short-term buying momentum has accelerated above historical baselines. The Move: Go! An upward-sloping HMA is your green light to ride the bullish move. Use the line as a dynamic trailing guide to stay in winning trades as long as the upward angle holds.
🔍 Two Simple Signals to Watch
1. The Slope Direction Flip (Color / Direction Change)
The primary entry and exit trigger for the HMA is the exact moment its slope changes direction.
- The Logic: Unlike Simple Moving Averages (SMAs) which take many bars to turn around, the HMA turns almost instantaneously at swing highs and swing lows. A Buy Signal occurs when the HMA slope pivots from downward to upward; a Sell/Exit Signal occurs when the slope pivots from upward to downward.
2. The Dual HMA Crossover (Fast vs. Slow)
Traders often pair a fast HMA (e.g., 9-period) with a slower baseline HMA or EMA (e.g., 21-period or 55-period).
- The Logic: When the faster HMA crosses above the slower average, it confirms an explosive shift in momentum, filtering out false turns. When the fast HMA crosses below the slower baseline, it confirms trend deterioration.
💡 The Simple Secret
Think of the HMA as a moving average with sports car handling. Standard moving averages behave like massive cargo ships that take miles to turn around, often giving you a signal long after the move is over. The Hull Moving Average uses square-root math to eliminate the lag entirely, letting you catch trend reversals almost in real time while smoothing out erratic market jitter.

Sometimes the Broker Really Is the Problem. Sometimes It’s You.
Let's be fair.
Slippage is real.
Spreads widen.
Orders get rejected.
Platforms freeze at the worst possible moment.
Brokers can absolutely cause execution problems.
But there's another side of this that traders don't like talking about.
Sometimes the broker gets blamed for a trade that was simply entered at the wrong time.
Imagine this:
You see a breakout forming.
You wait for it.
The candle starts moving fast.
You get excited.
Click.
Filled worse than expected.
Price reverses.
Stop gets hit.
Now you're angry.
"Broker manipulated my entry."
Maybe.
Or maybe you entered after the move had already happened.
That's the uncomfortable possibility.
Because blaming execution is a lot easier than admitting:
"I chased the trade."
And traders are incredibly creative when protecting their own ego.
The spread was weird.
The platform lagged.
The broker hunted my stop.
The market was manipulated.
Sometimes those explanations are legitimate.
But here's what matters:
Can you prove it happened consistently, or are you using it to explain one trade you regret?
That's where a trading journal becomes useful.
Record the entry.
Record the expected price.
Record the actual fill.
Note the spread.
Note the market conditions.
If you keep seeing the same execution issue, now you have evidence.
Maybe your broker really is causing problems.
Maybe you're trading during illiquid periods.
Maybe you're entering during major news.
Or maybe...
you're simply clicking too late.
And that's a completely different problem.

Professional traders don't automatically blame the broker when execution goes wrong.
They investigate.
Was liquidity thin?
Was volatility unusually high?
Was the spread normal?
Did I enter after the move?
Was my order type appropriate?
Did I understand the instrument I was trading?
Because there's a huge difference between a bad fill and a bad decision.
And you need to know which one you're dealing with.
The next time a trade goes badly, resist the urge to immediately find someone to blame.
Before you contact support, ask yourself:
"If the broker gave me the exact fill I wanted, would this still have been a bad trade?"
If the answer is yes...
You've just found something much more useful than a villain.
You've found something you can actually fix.