Nvidia Reports Earnings
....................................................................................................................


Good morning,
We're starting Wednesday with a bit of a rebound. After stocks slid yesterday because interest rates spiked, futures are pointing up. The tech-heavy Nasdaq is leading the charge, up 0.7%, while the S&P 500 is tracking about 0.3% higher. The Dow, which doesn't care quite as much about tech, is sitting pretty flat. It’s the ultimate "calm before the storm" morning.
Nvidia is the only headline that truly matters today. After the closing bell, the king of AI drops its earnings. This report has basically become the entire market's safety blanket. With inflation high and interest rates sitting near two-decade highs, investors are desperate for Nvidia to prove that the AI boom is still roaring and that Big Tech is still spending like crazy. If Nvidia delivers, it breathes life back into growth stocks; if it misses, things could get ugly fast.
Meanwhile, the Iran war is getting even louder. If you’re wondering why inflation is still such a headache, look no further than the Middle East. There is still no end in sight, and President Trump just raised the stakes again. He threatened to launch fresh attacks on Iran in the coming days if they don't sign a peace deal soon, promising once more that he will end the war "very quickly."
It’s an "all eyes on the after-hours" Wednesday. Tech is trying to shake off the war and inflation talk, but Nvidia holds all the cards today.

🔍 Nvidia Faces Growing AI Chip Rivalry Ahead of Q1 Earnings
AI heavyweight Nvidia (NVDA) is set to report its highly anticipated first-quarter results on May 20. While demand remains high, the tech giant is navigating an evolving competitive landscape as aggressive hardware rivals like Cerebras (CBRS)—which launched its blockbuster IPO last week—begin vying for market share.
📉 Nvidia Carries Biggest S&P 500 Short Position Into Earnings
Nvidia heads into its Wednesday earnings report saddled with the largest short position in the S&P 500, with options markets pricing in a massive $3.5 billion one-day swing. Despite the heavy betting by short sellers, HSBC analysts expect another "beat and raise" quarter for the chipmaker, which is up over 63% past-year.
⚠️ Stocks Under Pressure as Growing Yield Divergence Sparks Correction Fears
Global equity markets are facing intense pressure as a widening divergence between booming stock indices and a cautious bond market rings alarm bells. While the S&P 500 has repeatedly brushed off Iran war anxieties to hit records, government bonds are flashing warning signs as they lock in expectations for prolonged inflation.
🚨 U.S. Treasurys Enter 'Danger Zone' as 30-Year Yield Hits 2007 Highs
Fixed-income markets intensified their selloff, pushing the 30-year U.S. Treasury yield above 5.19%—its highest level in nearly two decades. HSBC strategists warn that bonds have entered a critical "danger zone," raising fears that sticky energy inflation will spill over and disrupt broader risk assets.
💵 Dollar Hits 6-Week High on Sticky Inflation and Iran War Risks
The U.S. dollar held firm near a six-week high on Wednesday as investors brace for a prolonged monetary tightening cycle driven by war-related price pressures. The greenback’s safe-haven ascent has put renewed pressure on international currencies, pushing the Japanese yen back into the official intervention zone.
🌏 Asian Stocks Fall for 4th Day as Bond Selloff Eclipses AI Optimism
Exchanges across Asia-Pacific declined for a fourth consecutive session as surging global borrowing costs hammered investor sentiment. Trading volumes remained defensive, with regional participants heavily sitting on cash and awaiting Nvidia’s earnings to see if the firm can single-handedly rescue tech sentiment.
🥈 Gold and Silver Dip while Citi Visualizes 50-Year Aluminum Bull Run
Precious metals fell to 1.5-month lows as a surging dollar and soaring bond yields dented the appeal of non-yielding assets. In contrast, Citi analysts are heavily touting aluminum, pointing to its most bullish structural setup in over 50 years and forecasting prices to surge 12% to average $4,000 per metric tonne.

The Market Loves Hurting Crowded Positions
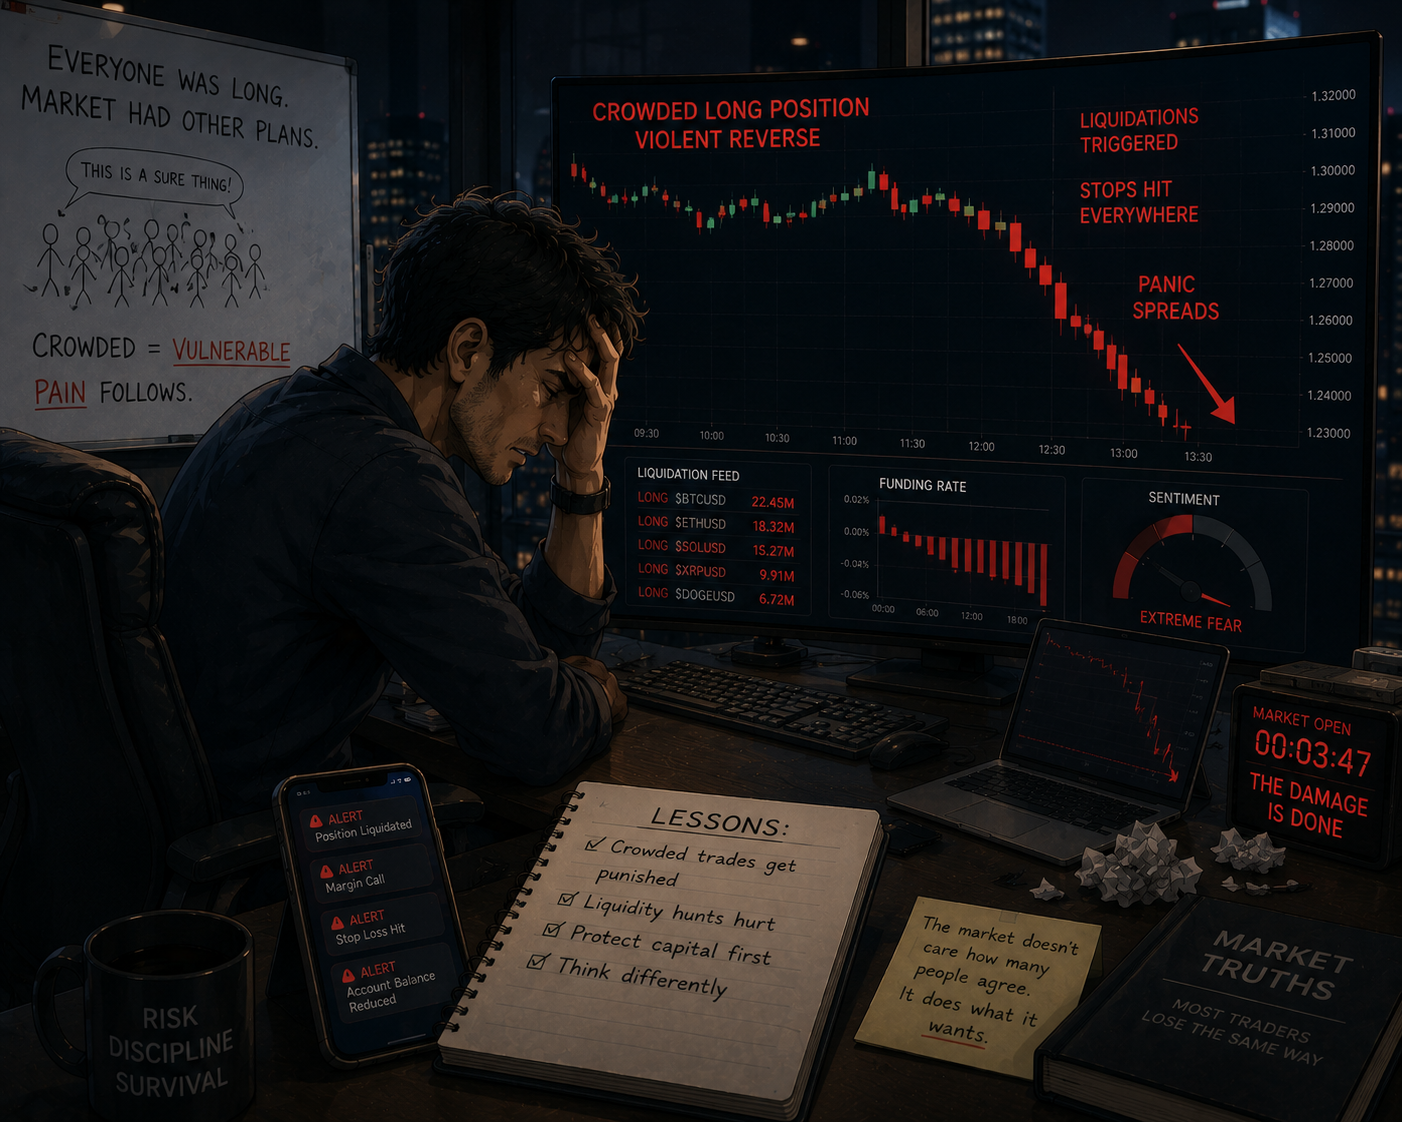
Everything looks obvious. Everyone is leaning the same way. The trade feels safe because so many traders agree with it.
Then the market moves hard in the opposite direction.
That’s how pain trades happen.
Short squeezes and crowded reversals force traders out fast. Stops get triggered. Positions get liquidated. Panic buying or selling pushes price even further, creating moves that feel irrational in the moment.
The market often moves where it causes the most discomfort.
Many traders get trapped because they focus only on being right. They forget to think about positioning, sentiment, and where pressure might build.
Strong traders stay aware of crowded trades. They respect volatility when positioning becomes extreme. They manage risk carefully instead of assuming consensus means safety.
Because crowded confidence can reverse violently.
When you understand how pain trades work, you stop chasing emotional extremes. You trade with more awareness of how markets actually behave under pressure.
Risk hides where everyone feels comfortable.
Some traders like exploring how positioning and market psychology drive unusual price moves.
If that’s you, you can explore a few market reads here:

Double Top
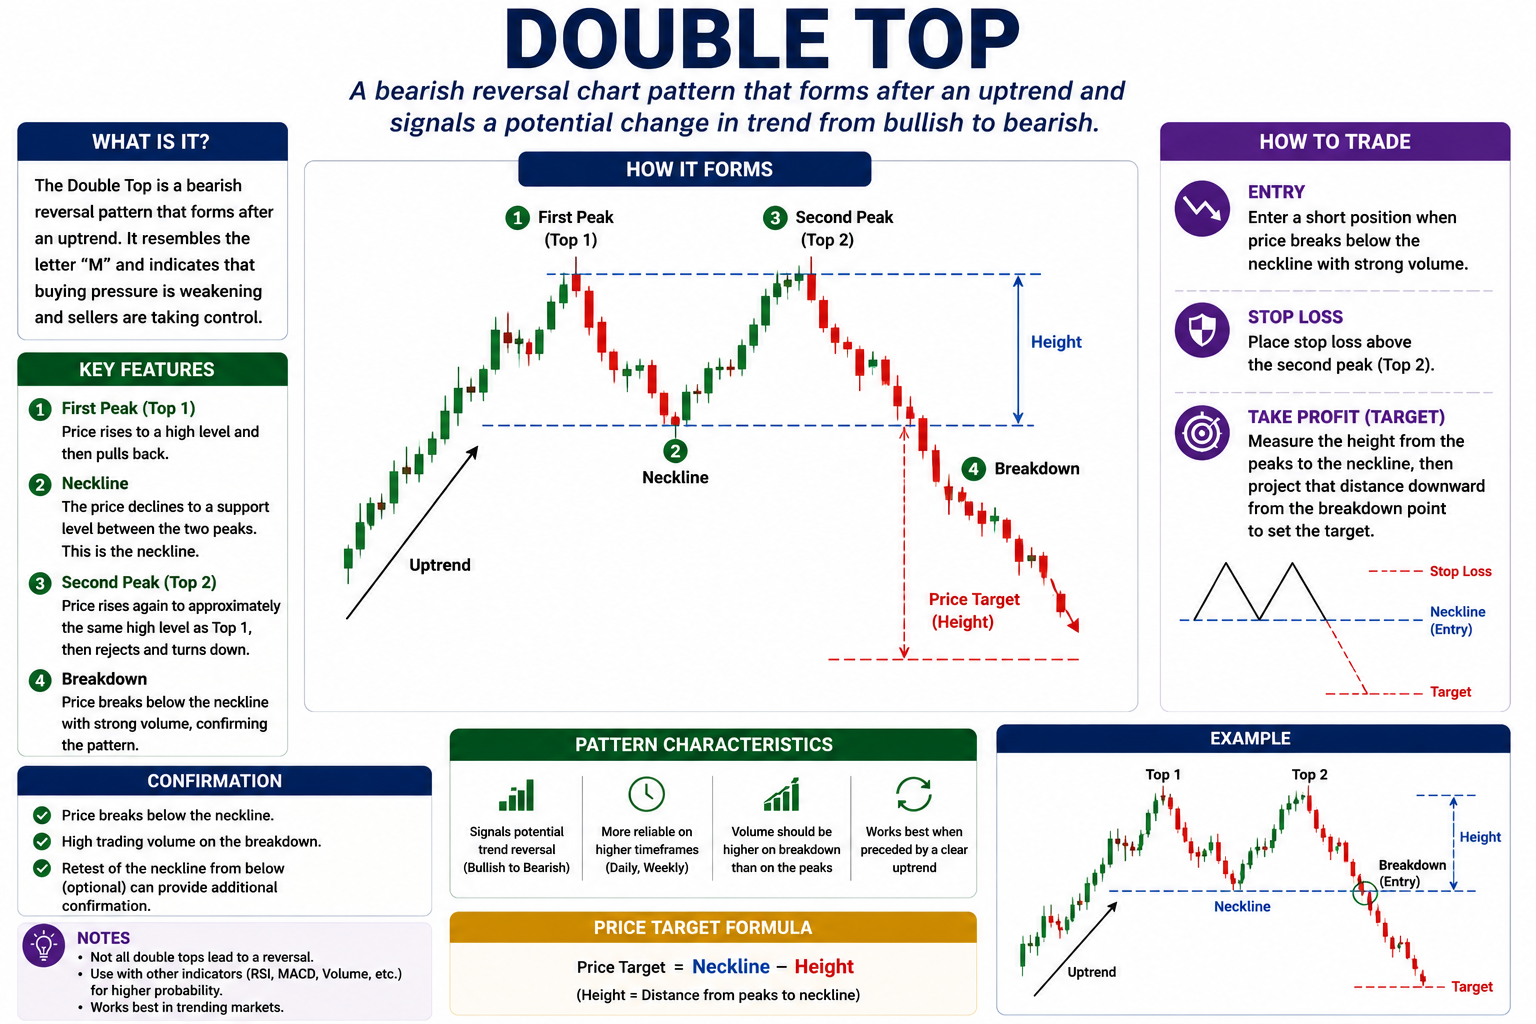
The Double Top is a classic "M" shaped pattern that signals a major uptrend has hit a ceiling. It shows that buyers tried twice to push the price higher but were rejected both times, allowing the sellers to take total control.
🔴 The Red Zone (The First Peak)
- The Meaning: Price rallies sharply and hits a new high. At this point, the market looks incredibly strong, and it feels like the price will keep climbing.
- The Move: Wait. This is just the first "leg" of the pattern. You are waiting to see if this high point is an actual barrier.
🟡 The Yellow Zone (The Middle Valley)
- The Meaning: Price drops slightly (forming the middle valley of the "M") but then finds a temporary floor and bounces back up toward the first high.
- The Move: Watch closely. This middle low point is called the Neckline. It is the critical boundary that the sellers must eventually break to prove they have won.
🟢 The Green Zone (The Second Peak & Break)
- The Meaning: Price hits the same high level as before but completely refuses to go higher. It rolls over, drops, and blasts straight down through the Neckline.
- The Move: Go! This is the signal to sell or short. The break below the neckline confirms that the buyers are completely exhausted and a new downward trend has officially begun.
🔍 Two Simple Signals to Watch1. The Twin Peaks
The two "tops" do not have to be perfectly level, but they should be very close to the same price area.
- The Logic: This shows a "Wall of Supply" (Resistance) at that price. No matter how hard the bulls push, the sellers instantly step in to block them.
2. The Breakout Volume
Watch the amount of trading (Volume) when the price breaks downward through the Neckline.
- The Logic: If the break happens with a large spike in volume, it means the "Big Players" are aggressively dumping the asset. If volume is tiny, the drop might just be a brief retest before going back up.
💡 The Simple Secret
The "M" shape is a failed test of higher prices. The market tried to break out into a new high territory twice, and failed twice. A common rule for setting targets is to measure the distance from the peaks down to the neckline, and expect the price to drop that same distance below the breakout point.

The Trade That Ruined the Day
You were actually doing fine.
Maybe green.
Maybe slightly red.
But controlled.
Rules followed.Risk managed.
Mind relatively calm.
Then the session should’ve ended.
But instead, your brain whispers the most expensive sentence in trading:
“One more trade.”
Not because the setup was amazing.
Not because your system demanded it.
Because emotionally… you weren’t satisfied yet.
Maybe you wanted a bigger green day.
Maybe you wanted to recover a loss.
Maybe you just didn’t like stopping.
So you stayed.
And THAT is where the day changed.
It’s crazy how often one unnecessary trade rewrites an entire session.
A disciplined day suddenly becomes reckless.
A small loss becomes frustrating.
A good mindset turns emotional fast.
And the painful part?
You usually know it while it’s happening 😭
You enter the trade and deep down there’s this tiny voice saying:
“You probably shouldn’t be doing this.”
But ego is loud at the end of sessions.
Especially after hours of decision-making.
Mental fatigue makes bad ideas sound reasonable.
That’s why late-session mistakes are so common.
Not because traders suddenly become stupid.
Because discipline gets weaker the longer emotions stay involved.
Here’s the truth most traders avoid:
The “one more trade” is rarely about opportunity.
It’s about emotional discomfort.
You don’t want to stop:
- Unsatisfied
- Red
- Bored
- Frustrated
- Incomplete
So you look for one final trade to fix the feeling.
But markets don’t reward emotional closure.
They punish it.
Professional traders respect endings.
That sounds simple… but it’s a REAL skill.
They know when the edge for the day is gone.
They know when focus is fading.
They know when continuing becomes emotional instead of strategic.
And most importantly?
They don’t treat discipline like a flexible suggestion.
So here’s something worth trying:
Create a hard session-ending ritual.
Not mentally. Physically.
Close the platform.
Log the trades.
Shut the laptop.
Leave the room if you have to 😂
Because once your rules say stop, the goal is no longer making money.
The goal becomes protecting the discipline that made the day solid in the first place.
And honestly?
A lot of trading success comes down to surviving your own urge to interfere with a perfectly acceptable day 🧠