Nvidia Earnings Report Ahead
....................................................................................................................


Good morning.
The market is doing that thing where everyone pretends to be calm while waiting for two very important numbers.
US stock futures are mostly flat today, with the Dow and S&P 500 barely moving and Nasdaq futures slightly lower after tech stocks rallied yesterday.
First on the agenda: inflation.
Investors are waiting for the latest core PCE reading, the Fed’s preferred inflation gauge. Economists expect it to remain at 3.3%. If inflation is cooling, markets could breathe a little easier. If it’s heating back up, well… expect traders to suddenly become very interested in interest rates again.
Then comes the main event.
Nvidia reports earnings after the closing bell.
At this point, Nvidia earnings are almost a market event of their own. The company has become one of the biggest beneficiaries of the AI boom, and investors are looking for more than another strong quarter. They want proof that the enormous money being poured into AI is actually producing returns.
And with the Fed’s Jackson Hole gathering happening this week, traders have plenty to digest.
Inflation this morning.
Nvidia tonight.
Fed commentary later this week.
Just another quiet Wednesday on Wall Street.

📊 Stock Futures Mixed Ahead of Inflation Print and Nvidia Earnings
U.S. stock index futures traded mixed early Wednesday as investors positioned ahead of key domestic inflation data and Nvidia's high-stakes quarterly report. S&P 500 and Nasdaq-100 futures dipped slightly while Dow contracts edged up 0.07%, following a positive regular session boosted by falling bond yields and cooling energy prices.
🤖 Nvidia Snaps Seven-Day Losing Streak Ahead of Critical Q2 Print
Shares of Nvidia (NVDA) snapped a seven-day losing streak—its longest since 2022—rising 2.19% on Tuesday ahead of its fiscal second-quarter financial release. The highly anticipated report serves as a major litmus test for Wall Street's AI infrastructure trade and broader semiconductor valuations.
🛢️ U.S. Crude Drops Near $80 on Hormuz Shipping Route Hopes
Oil benchmarks declined on Wednesday as West Texas Intermediate hovered near $80 per barrel, driven by softer-than-expected U.S. sanctions on Iran. Downward momentum was reinforced after Iranian and Omani officials opened discussions on establishing a joint temporary shipping route to administer transit through the Strait of Hormuz.
₿ Bitcoin Rally Stalls at $80,000 Resistance Before Fed Signals
Bitcoin’s recent rally ran into technical resistance at the psychological $80,000 threshold as market participants paused ahead of upcoming U.S. inflation data. Crypto traders are seeking fresh monetary policy cues to assess whether the digital asset’s latest multi-session surge can maintain upward momentum.
🥇 Gold Preserves Five-Day Gain as Retreating Oil Eases Inflation Fears
Spot gold maintained its five-day winning streak during early trading as a steady pullback in global crude prices helped alleviate immediate consumer inflation anxieties, keeping bullion supported near multi-week highs.
📈 Bernstein Predicts Bitcoin Could Reach $500,000 by 2029
Bernstein analyst Gautam Chhugani laid out an updated valuation trajectory for Bitcoin, forecasting a base-case target of $150,000 by mid-2027 and $300,000 by late 2029. In a bull scenario where institutional capital accelerates into digital assets, Chhugani noted BTC could peak at $500,000 by 2029 on its way toward $1 million by 2033.
🌏 Global Equities Edge Higher on AI Optimism and Falling Crude
World stock markets broadly gained on Wednesday, supported by signs of diplomatic engagement around the Strait of Hormuz and resilient interest in artificial intelligence equities. Price action across international bourses remained largely rangebound as institutional desks awaited Nvidia's after-hours earnings announcement.

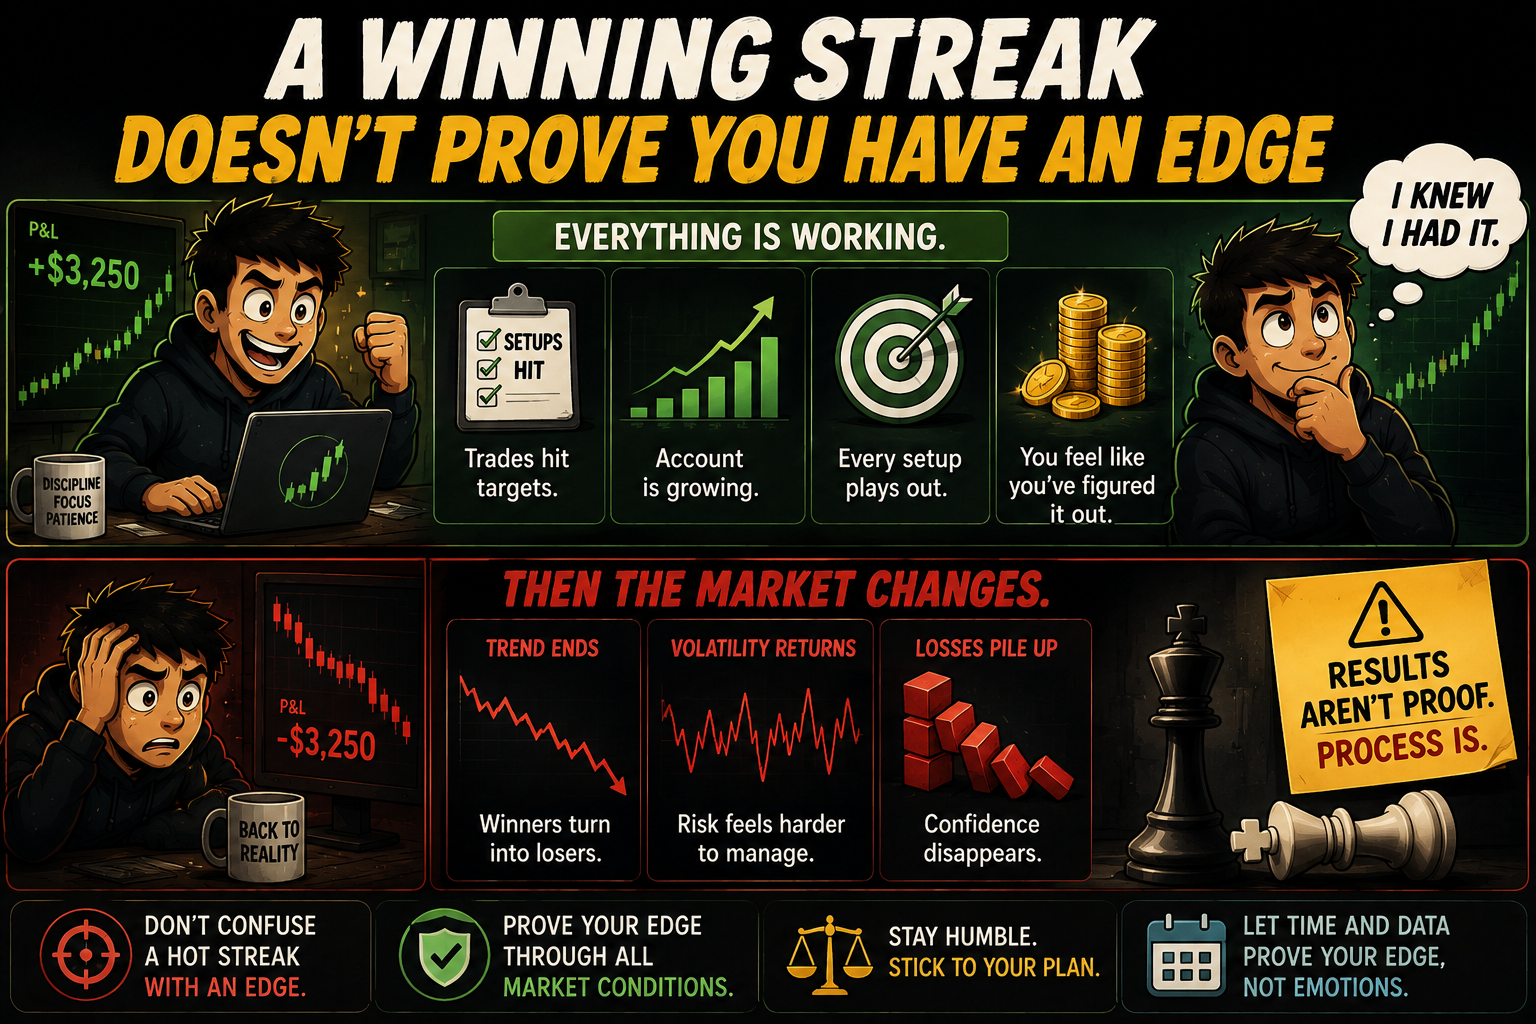
A Winning Streak Doesn't Prove You Have an Edge
Everything is working.
Your trades are hitting targets. Your account is growing. Every setup seems to play out exactly as expected.
So you start believing you've finally figured it out.
Maybe.
Or maybe the market is simply making your strategy look better than it really is.
Favorable conditions can make average strategies look brilliant. A strong trend can turn questionable entries into winners. Low volatility can make risk feel easier to manage. A rising market can make almost everyone feel like a genius.
The danger comes when traders mistake those results for skill.
They increase their position size. They loosen their rules. They take more trades because they believe they've found something special.
Then the market changes.
Suddenly, the same decisions don't work anymore.
Strong traders don't judge their ability by a short winning streak. They ask whether their process works across different conditions. They track their decisions, review their results, and stay humble when things are going well.
Because a good outcome doesn't always mean a good decision.
Sometimes you made the right trade.
Sometimes you just got lucky.
Knowing the difference is part of becoming a better trader.
Good trading requires more than a string of winning trades. Learning how different market conditions affect performance can help you build a more honest view of your own edge.
If you'd like to explore more thoughtful market perspectives, you can discover a few market newsletters here:

The Bearish Engulfing Pattern
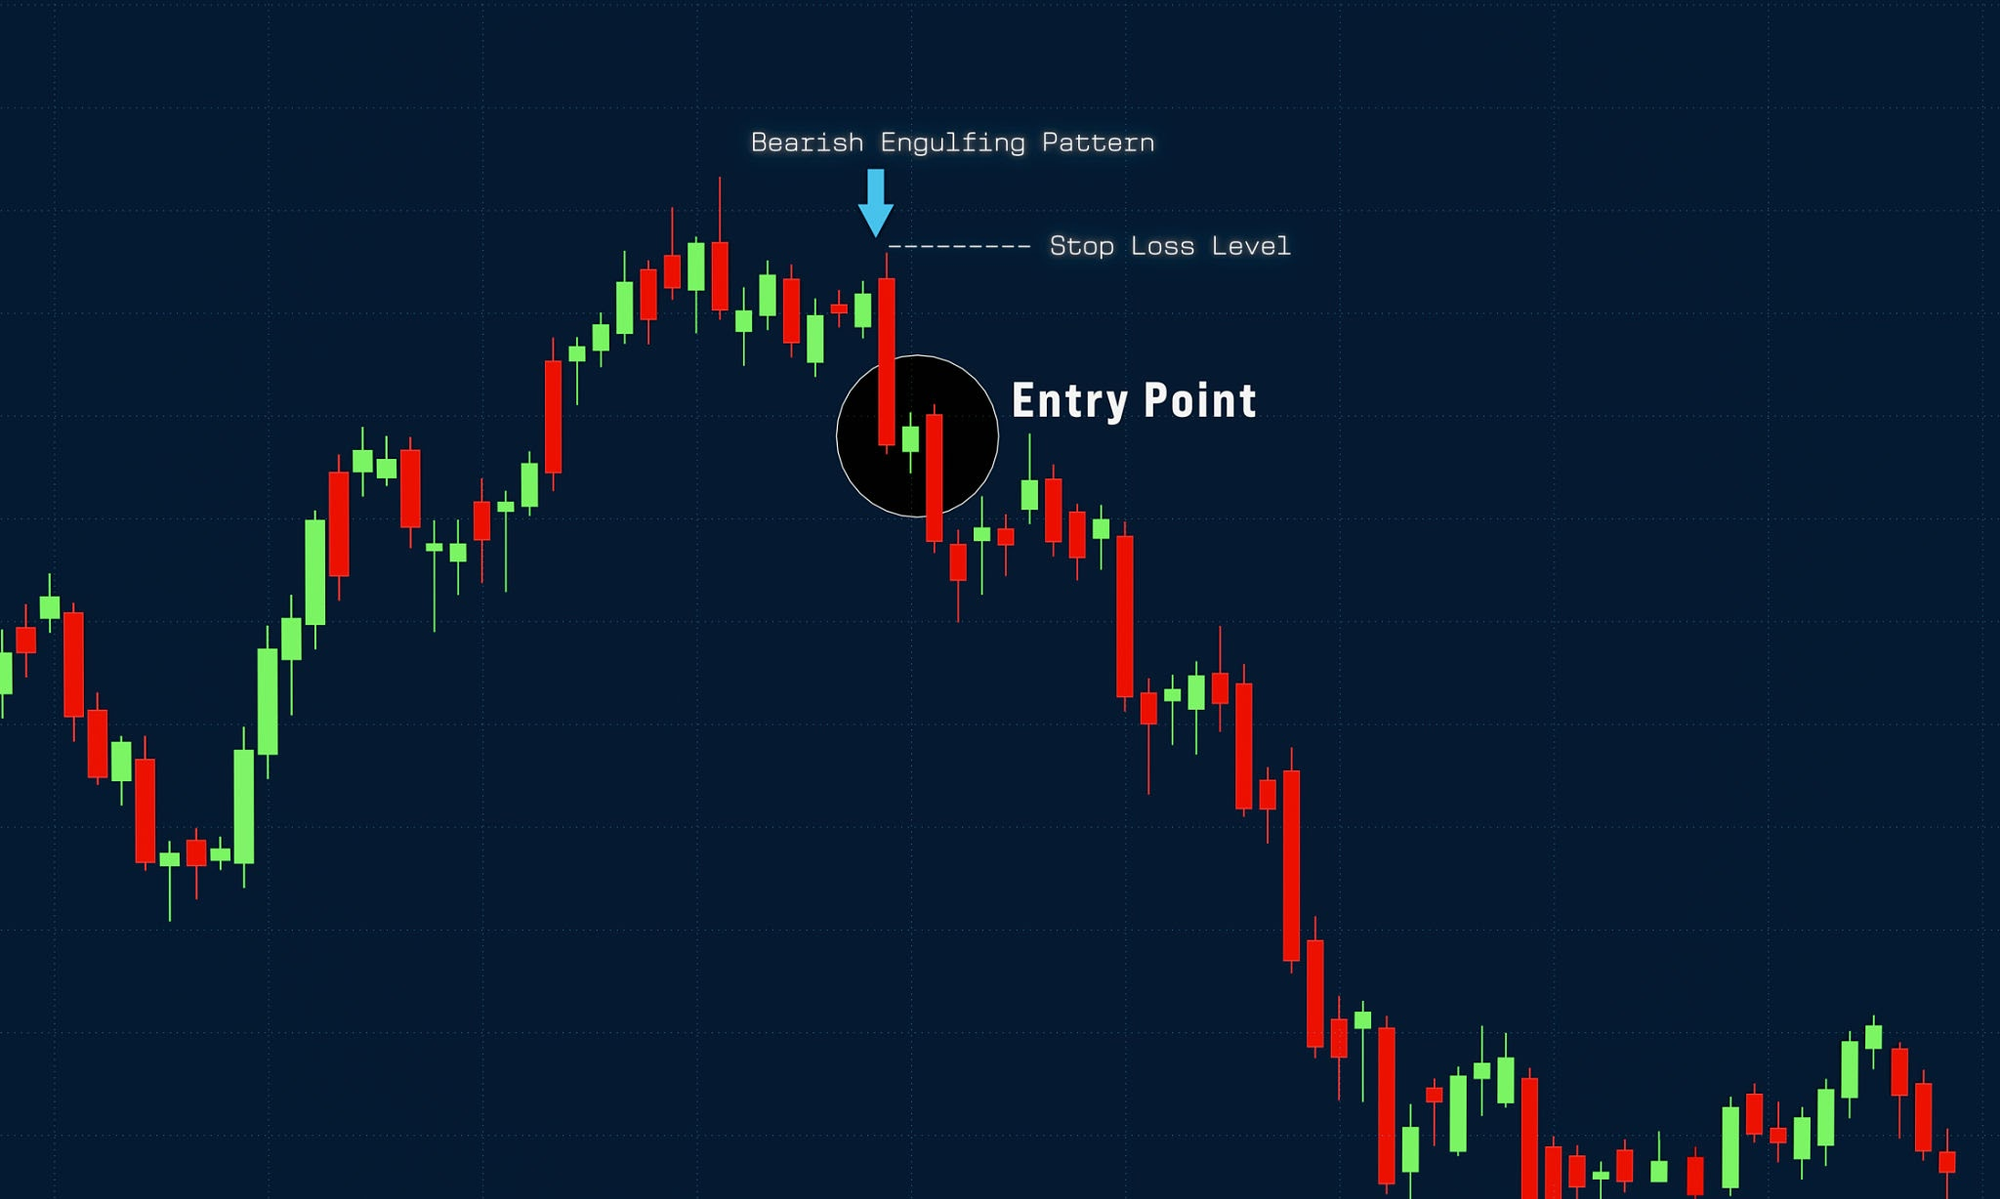
Bearish Engulfing Reversal and Entry Setup. Source: Torsten Asmus / Getty Images
The Bearish Engulfing is a high-reliability, two-candle reversal pattern that appears at the peak of an extended uptrend or corrective rally. It occurs when a small bullish (green) candle is immediately followed by a large, aggressive bearish (red) candle whose real body completely "engulfs" or covers the entire real body of the preceding candle. It signals an abrupt regime shift where sellers violently overwhelm buyers in a single session.
🔴 The Red Zone (The Prior Uptrend & Small Green Candle)
The Meaning: The market is climbing under buyer control, ending with a small green candle. While the trend still looks bullish on the surface, the shrinking candle body reveals that buyers are running out of steam at higher valuations.
The Move: Stop chasing long positions. The upward momentum is stalling. However, do not short prematurely until the second candle confirms seller dominance.
🟡 The Yellow Zone (The High Open & Intraday Reversal)
The Meaning: The next candle opens at or above the prior candle's close (often with an optimistic gap up), but aggressive sellers step in immediately and push the price relentlessly lower throughout the session.
The Move: Watch closely. The bears are exerting massive pressure, but the pattern is only valid if the red candle officially closes below the open of the prior green candle.
🟢 The Green Zone (The Full Engulfing Close)
The Meaning: The red candle closes firmly below the opening price and bottom of the preceding green candle's body, completely swallowing it.
The Move: Go! A confirmed close on the engulfing candle is your official green light to exit longs or enter a short trade. Place your stop-loss just above the high of the red candle to manage risk.
🔍 Two Simple Signals to Watch
1. Relative Candle Size & Multiple-Candle Overlap
Examine the size and reach of the red engulfing candle relative to the preceding price action.
- The Logic: A textbook setup occurs when the red candle's real body is significantly larger than the green candle. If the red candle is massive enough to engulf the bodies of two, three, or more preceding candles in a single swipe, it shows overwhelming institutional distribution.
2. The Volume Confirmation Spike
Compare the volume bar of the red engulfing candle against the preceding days.
- The Logic: The engulfing red candle must print heavy, above-average volume. A surge in volume proves that institutional desks and market makers are aggressively liquidating and shorting, rather than a low-volume retail drift.
💡 The Simple Secret
Think of a Bearish Engulfing pattern as a swift ambush at the mountain peak. The buyers push the price to fresh highs at the open, but the sellers not only reject the move—they completely erase all of yesterday's gains and drive deep into negative territory before the closing bell. When this happens at a major resistance ceiling, Fibonacci level, or overbought indicator zone, it represents one of the most dependable top-reversal signals in trading.

"The Candle That Says “Enough.”
A market can spend hours climbing.
Green candle after green candle.
Buyers feel in control.
Then suddenly...
One candle shows up and swallows the previous one whole.

That's the bearish engulfing pattern.
It can look dramatic, but the real lesson isn't the shape of the candle.
It's what the candle represents.
A change in control.
Imagine price has been pushing higher all morning.
Buyers keep stepping in.
Then a new candle opens above the previous close, pushes higher for a while...
...and suddenly sellers take over.
Hard.
By the close, that bearish candle has completely engulfed the body of the previous bullish candle.
That's your warning:
"Something just changed."
But here's where traders get themselves into trouble.
They see the pattern and immediately think:
"SHORT!"
Not so fast.
A bearish engulfing candle by itself isn't a magical sell button.
Where did it happen?
At resistance?
After an extended move?
Near a major supply zone?
Did momentum actually weaken?
Is there confirmation afterward?
Context matters.
A bearish engulfing candle in the middle of random sideways price action isn't nearly as interesting as one appearing after a strong rally directly into a level sellers have defended before.
Think of the candle as a conversation between buyers and sellers.
The previous candle says:
"We're still buying."
The engulfing candle responds:
"Not anymore."
That's the information you're really trading.
So how can you use it?
Don't chase the candle simply because it looks impressive.
Instead, wait for the pattern to form in a meaningful location.
Then look for confirmation that sellers are actually following through.
A common approach is to use the low of the engulfing candle as a reference for confirmation or entry, with the stop placed beyond a logical invalidation point.
Your target should come from structure, not from randomly picking a number that gives you a pretty risk-to-reward ratio.
And remember:
A reversal pattern is a possibility, not a promise.
The market can print the most beautiful bearish engulfing candle you've ever seen...
...and immediately rip higher.
That's why your stop matters.
That's why context matters.
And that's why good traders don't fall in love with patterns.
They use them as evidence.
One candle doesn't tell you where the market must go.
It tells you something about what just happened.
Your job is to decide whether that information is actually worth risking money on.