Novo Nordisk Tumbles 7%
....................................................................................................................



Good morning.
Apparently, Wall Street needed one night to get over the Fed.
Stocks took a hit after Wednesday’s rate hike, then came right back swinging Thursday. The Dow gained 0.6%, the S&P 500 jumped 1.1%, and the Nasdaq surged 1.7%, led by technology stocks.
Now the market is taking a breather.
US stock futures are barely moving this morning, with Dow futures up just 0.08% while S&P 500 and Nasdaq futures are flat.
The interesting part isn't really the Fed anymore.
It’s AI.
Despite higher rates and inflation concerns, investors are still betting that the AI boom can keep driving corporate profits. That optimism helped tech stocks bounce hard on Thursday.
But there’s another thing to watch today: Fed officials.
Michelle Bowman and Jeffrey Schmid are scheduled to speak, giving investors another chance to hear how policymakers are thinking about Wednesday’s unanimous rate hike.
Meanwhile, the week is still mixed. The Dow is down 1.5%, the S&P 500 is down 0.3%, while the Nasdaq is up 0.3%.
So Friday starts quietly.
But after Thursday's comeback, Wall Street may be asking one question:
Was that just a bounce, or is AI ready to take the wheel again?

📊 U.S. Stock Futures Rise as Falling Oil Lifts Sentiment
U.S. equity futures climbed Monday morning as cooling oil prices provided relief following last week's Federal Reserve interest rate hike. Contracts on the Nasdaq-100 rallied 0.8%, while S&P 500 and Dow futures added 0.5% each, with traders also eyeing diplomatic developments ahead of an expected bilateral summit between Donald Trump and Xi Jinping.
🛢️ Oil Slides to One-Week Low on UN Diplomacy Hopes
Crude benchmarks dropped to their lowest levels in over a week as market participants held out hope for diplomatic progress surrounding the Iran conflict during this week's United Nations meetings. Easing supply worries were further aided by a steady recovery in Saudi export flows despite ongoing regional drone strikes.
₿ Bitcoin Surges Above $81,000 on Heavy Spot ETF Inflows
Bitcoin reclaimed the $81,000 threshold for the first time in two weeks, propelled by a sharp rebound into U.S. spot exchange-traded funds. The late-week surge in institutional allocations fully erased earlier outflows, restoring bullish momentum across digital asset markets.
🥉 Copper Advances on Tight Physical Supply and Smelter Maintenance
Copper futures gained up to 0.5% on Monday, marking their eleventh advance in the past twelve weeks. The industrial metal remains supported by tight global inventories and upcoming planned maintenance shutdowns across multiple Chinese smelting plants slated for October and November.
💊 Novo Nordisk Tumbles 7% Despite Ambitious 2035 Drug Targets Shares of Novo Nordisk fell 7% after the Danish pharmaceutical firm detailed its post-Wegovy commercial strategy. Despite outlining plans to introduce over five potential blockbusters by 2030 and generate 150 billion Danish kroner ($23B) in pipeline sales by 2035, investor sentiment was dampened by projected revenue growth merely matching industry peers.
🇬🇱 Greenland Mining Stocks Skyrocket on U.S.-Denmark Security Deal
Shares of Arctic resource developers surged in premarket trading after Washington and Copenhagen struck a landmark security pact covering Greenland. Greenland Energy soared over 141%, Greenland Mines rallied nearly 70%, and Critical Metals climbed 30% on expectations of expanded U.S. military backing and western infrastructure investment.
🛢️ Brent Drops Near $101 as Saudi Flows Remain Resilient
International benchmark Brent crude tumbled 2.11% to $101.68 per barrel, while WTI fell 2.1% to $98.19. Oil markets continued to price out immediate supply disruptions after broader commercial crude flows from Saudi Arabia demonstrated unexpected resilience despite weekend missile and drone incidents.

Not Every Market Is Trending
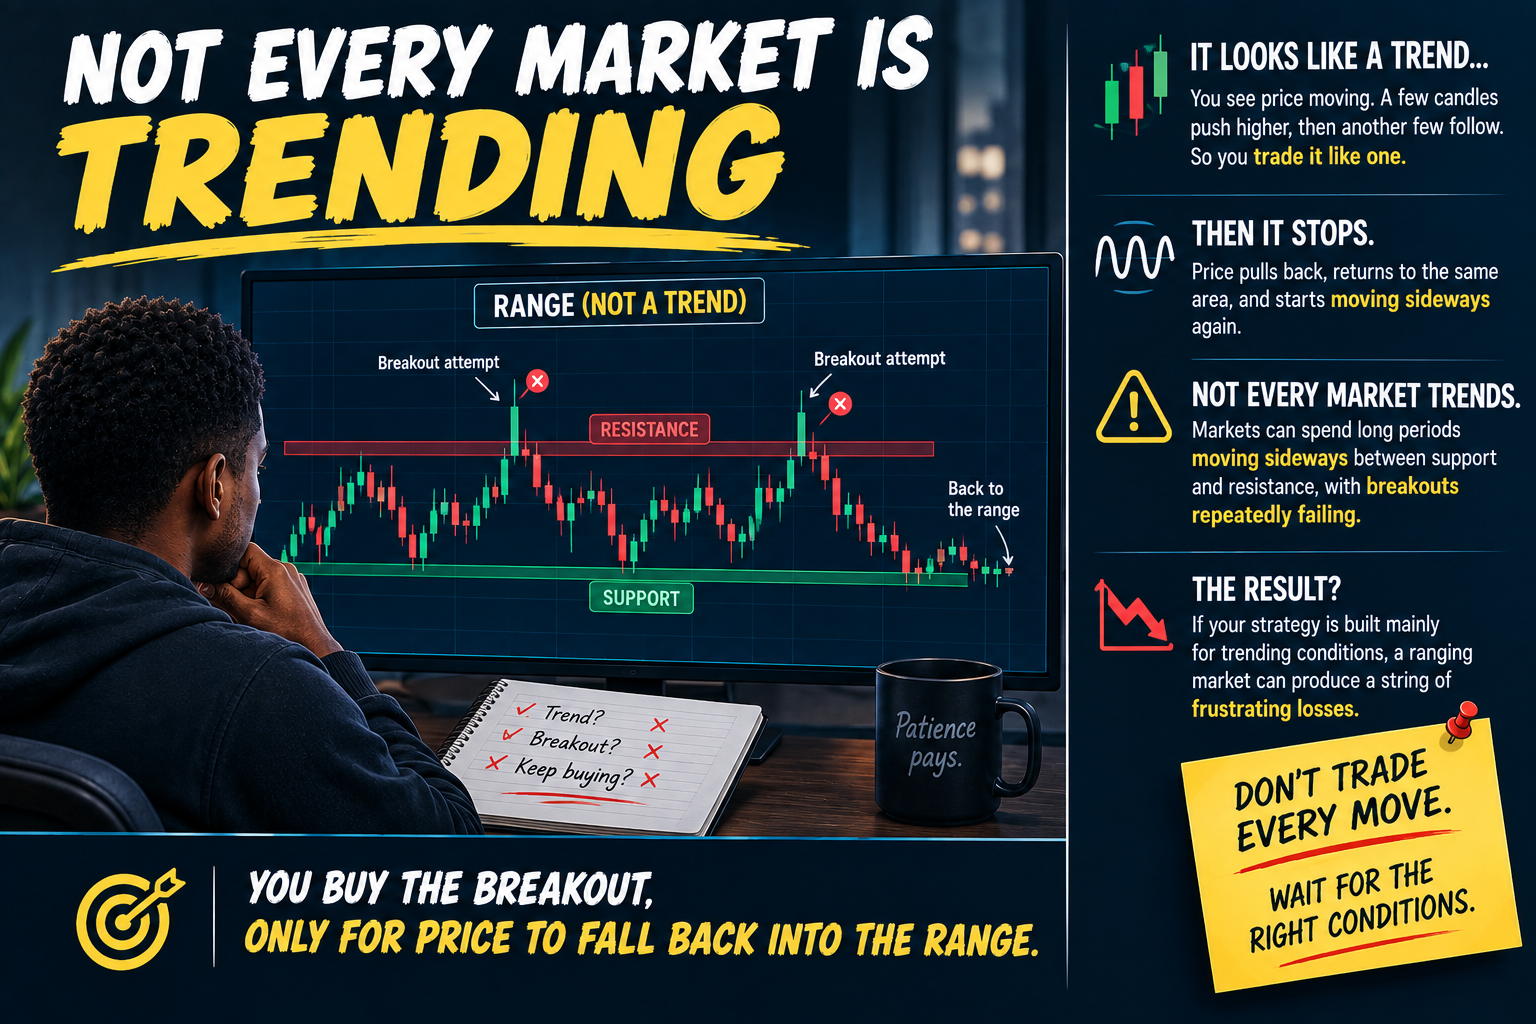
You see price moving.
A few candles push higher, then another few follow.
It looks like the start of a trend, so you trade it like one.
Then the move stops.
Price pulls back, returns to the same area, and starts moving sideways again.
This is where traders can get trapped by treating every market condition as a trend.
Markets don't trend all the time. They can spend long periods moving sideways between support and resistance, with breakouts repeatedly failing.
If your strategy is built mainly for trending conditions, a ranging market can produce a string of frustrating losses.
You buy the breakout, only for price to fall back into the range.
You sell the breakdown, only for buyers to push price back up.
The problem isn't necessarily your entries.
The problem may be the market environment you're applying them to.
That's why identifying the current market condition matters.
A trending market may reward momentum and continuation strategies.
A ranging market may require a completely different approach — or no trade at all.
Before taking a setup, ask yourself:
"Is this market actually trending, or am I forcing a trend onto sideways price action?"
You don't need to trade every movement.
Sometimes recognizing that the market is ranging is the edge.
A strategy can be profitable in the right conditions and lose repeatedly when those conditions aren't there.
Market conditions can change without warning, and the same strategy won't behave the same way in every environment. Reading different market perspectives can help you recognize those changes more clearly.
Explore more market newsletters here:

Elder’s Force Index (EFI)
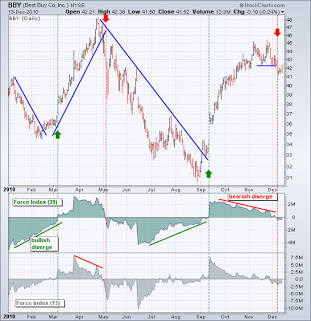
Elder's Force Index (EFI) Zero-Line Crosses and Divergences. Source: ChartSchool - StockCharts.com
Created by Dr. Alexander Elder, the Force Index (EFI) combines three essential pieces of market data into a single oscillator: direction, extent (price change), and volume. By multiplying the change in closing price by the current period's volume—then smoothing it with an Exponential Moving Average (EMA)—the Force Index calculates the raw power behind every market move. It oscillates above and below a central Zero Line to quantify whether buyers or sellers are exerting greater financial pressure.
🔴 The Red Zone (Negative Territory / Deep Below Zero)
- The Meaning: The EFI line plunges below the Zero Line into negative values. Selling volume is overpowering buying volume, confirming that bears are exerting substantial force on the market.
- The Move: Protect capital. In trend-following strategies, a sustained negative reading confirms a dominant downtrend. For long traders, a deep negative spike warns that institutional selling is active and pullbacks are too aggressive to buy blindly.
🟡 The Yellow Zone (Hovering Along the Zero Line)
- The Meaning: The EFI line oscillates tightly around the 0.00 baseline. Price changes are minimal or volume is drying up.
- The Move: Hold and wait. Neither bulls nor bears possess decisive force. Avoid executing breakout trades while EFI is flat against the zero line, as low-conviction moves are prone to choppy whipsaws.
🟢 The Green Zone (Positive Territory / Surging Above Zero)
- The Meaning: The EFI line climbs above the Zero Line into positive territory. Buying volume is actively driving prices higher, confirming that the bulls possess real institutional backing.
- The Move: Go! A sustained position above the zero line gives the green light to ride long trends. In a bull market, when a short-term pullback dips below zero and then snaps back above, it triggers a clean continuation buy signal.
🔍 Two Simple Signals to Watch
1. The Dual-Timeframe Setup (2-Period vs. 13-Period EFI)
Dr. Elder designed a two-tiered system pairing a fast 2-period EMA of Force Index with a 13-period intermediate EMA:
- The 13-period EFI (Trend Filter): Identifies the macro trend. When it is above zero, the dominant trend is bullish; when below, bearish.
- The 2-period EFI (Timing Trigger): Identifies short-term buying opportunities within that trend. In an established bull trend (13-period EFI > 0), you wait for the 2-period EFI to drop below zero (a temporary pullback), then buy the moment it turns back up toward zero.
2. The High-Volume Divergence
Because EFI factors in volume size, divergences reveal when price trends are losing their capital support.
- The Logic: If the price prints a higher high but the Force Index prints a visibly lower peak, the rally is advancing on weaker volume or smaller price gains (Bearish Divergence), warning of an imminent breakdown. Conversely, higher EFI lows during lower price lows (Bullish Divergence) show smart money quietly absorbing selling pressure before a reversal.
💡 The Simple Secret
Think of the Force Index as measuring both the speed of a truck and the weight of its cargo. A light car rolling downhill at 50 mph has very little momentum, but a loaded semi-truck moving at 50 mph carries massive force. A price jump on thin volume won't move the EFI needle much, but a price increase backed by heavy institutional volume sends EFI soaring—proving the bulls have real muscle behind the wheel.

You’re Trading Someone Else’s Idea

You hear a market argument that makes sense.
Maybe it's a podcast on the drive to work.
Maybe a trader on X posts a long thread explaining why gold is about to explode.
Maybe a YouTube breakdown connects rates, inflation, liquidity, geopolitics and five other things you hadn't even considered.
And suddenly...
You have a thesis.
You didn't build it.
You inherited it.
But give it a few hours and you'll start talking about it like you've been studying the market for six months.
That's the dangerous part.
You absorb someone else's conclusion so completely that you forget where it came from.
Then price starts disagreeing.
Instead of reconsidering the trade, you defend the story.
"The market hasn't priced it in yet."
"They're just shaking people out."
"The bigger move is still coming."
Now you're no longer analyzing price.
You're protecting a narrative that doesn't even belong to you.
I've seen traders hold positions far longer than they should simply because they'd consumed so much content around the trade that being wrong started to feel embarrassing.
Not because they had strong evidence.
Because they'd become emotionally attached to the explanation.
And there's a reason this happens so easily.
A good market narrative is addictive.
It gives you a reason for everything.
Price rises?
"Exactly. That's what the thesis predicted."
Price falls?
"That's the setup before the bigger move."
Sideways?
"Accumulation."
At some point, the story becomes impossible to disprove.
And that's when it becomes dangerous.
A THESIS THAT CAN EXPLAIN EVERYTHING CAN ALSO JUSTIFY ANYTHING.
This doesn't mean you should ignore macro analysis, research, podcasts or other traders.
Quite the opposite.
Learn from them.
Steal ideas.
Challenge your thinking.
But before you put money behind someone else's thesis, force yourself to rebuild it in your own words.
Why do you believe this?
What would prove the idea wrong?
What does the chart need to do for the thesis to remain valid?
And if the person you borrowed the idea from disappeared tomorrow...
Would you still take the trade?
That's the test.
Because there's a big difference between learning from someone's analysis and carrying their conviction into the market.
The first makes you smarter.
The second makes you responsible for a position you may not actually understand.
Your money should be attached to your process, not someone else's confidence.
Listen widely.
Think independently.
And be very careful when another person's story starts sounding like your own voice.