Wall Street Hits New Highs
....................................................................................................................


Good morning, traders.
The S&P 500 and Nasdaq are hitting records, but there’s a catch: fewer stocks are actually participating in the party.
AI megacaps are doing most of the heavy lifting. Nvidia, Apple and Microsoft alone now make up more than 21% of the S&P 500, and all three are sitting near record highs. Nvidia even touched another all-time high on Tuesday.
But look beyond those names and the picture gets much less exciting.
Only about 25% of S&P 500 stocks were trading above their 50-day moving average at the end of last quarter. Meanwhile, the S&P 500 gained 2% in Q3, while the equal-weight S&P 500 fell 2% and the Russell 2000 dropped 7%.
That’s what UBS means by “the breadth of the rally has narrowed.”
The AI trade is still powerful. TSMC, Lumentum and cybersecurity stocks are also catching the wave. But when fewer stocks are carrying more of the index, investors have less room for mistakes.
Record highs look great on the screen.
The question is how many stocks are actually getting there with them.

📈 S&P 500 and Nasdaq Close at Record Highs as Earnings Season Approaches
Major U.S. stock benchmarks pushed to fresh all-time closing highs on Tuesday, with the S&P 500 gaining 0.58%, the Nasdaq climbing 0.45%, and the Dow advancing 0.49%. Wall Street’s momentum was supported by steady risk appetite as institutional desks pivoted focus toward upcoming corporate quarterly earnings reports.
🛢️ Oil Holds Steady Above $100 as Export Flows Balance Supply Risks
Crude benchmarks traded steadily on Wednesday, with Brent futures holding above $100 per barrel at $100.93 and WTI edging up to $89.59. Energy desks balanced increased Middle East maritime shipments against broader geopolitical conflict risks and an approaching weather disruption heading toward U.S. oil installations.
💵 Dollar Advances as Firm Energy Prices Put Fed Rate Hikes Back in Focus
The U.S. dollar index climbed 0.45% on Wednesday, supported by persistent triple-digit crude prices and rising bond yields. Currency traders adopted a defensive posture ahead of the release of the Federal Reserve’s September FOMC meeting minutes, keeping money markets attuned to potential interest rate adjustments before year-end.
🥇 Gold Dips 1% as Dollar Strength and Upcoming Fed Minutes Pressure Bullion
Spot gold fell nearly 1% to $4,122.73 per ounce on Wednesday, pressured by greenback strength and rising sovereign yields. Bullion faced selling pressure as market participants awaited the latest Fed meeting minutes to assess consensus among policymakers regarding further monetary tightening.
⚡ Bitcoin Slips Below $84K as 20-Minute Flush Erases $400M in Longs
Bitcoin dropped over $1,700 in an abrupt 20-minute sell-off early Wednesday, sliding beneath the $84,000 mark. The rapid price drop triggered cascading liquidations across crypto derivative exchanges, wiping out more than $400 million in leveraged bullish bets.
🇨🇳 China's Central Bank Extends Gold Accumulation Streak to Near Two Years
The People’s Bank of China added fresh bullion to its strategic reserves in September, extending its sovereign gold accumulation campaign close to a full two-year milestone. Beijing continued its steady reserve diversification even as global gold prices pulled back toward the $4,100 level.
🇰🇷 South Korean Retail Traders Lose $1.7B on Leveraged Chip ETFs South Korean retail investors suffered an estimated 2.3 trillion won ($1.7 billion) in cumulative losses from leveraged single-stock exchange-traded products linked to Samsung Electronics and SK Hynix. Regulatory data released from the Financial Supervisory Service highlighted sharp volatility and leveraged decay tied to domestic semiconductor product swings.

Your Best Setup Can Still Be a Bad Trade

You find a setup you've been waiting for all week.
The trend is clean. The level is strong. Your entry rules are satisfied.
Everything looks right.
So you take the trade.
But there's one problem.
The potential reward isn't worth the risk anymore.
Maybe the entry came later than planned. Maybe price already moved most of the expected distance. Maybe the stop has to be wider because of current volatility.
The setup can still be valid.
But the trade itself may no longer be attractive.
This is an easy distinction to miss.
Traders often focus on whether a setup is good enough to trade without asking whether the current price still offers a good opportunity.
A setup can have a strong probability of working and still have poor expected value at the price you're getting.
That's why you need to evaluate the trade as it exists now, not as you originally imagined it.
If the entry is late, wait.
If the target is too close, pass.
If the stop is too wide, reduce the position or skip the trade.
You don't get paid for finding setups.
You get paid for making good decisions about them.
A good setup is only a good trade when the price, risk, and potential reward still make sense.
Risk management is often what separates a good trade idea from a sustainable trading process. Exploring different perspectives on position sizing and risk can help you build better habits.
Explore more market newsletters here:

The Inverted Hammer
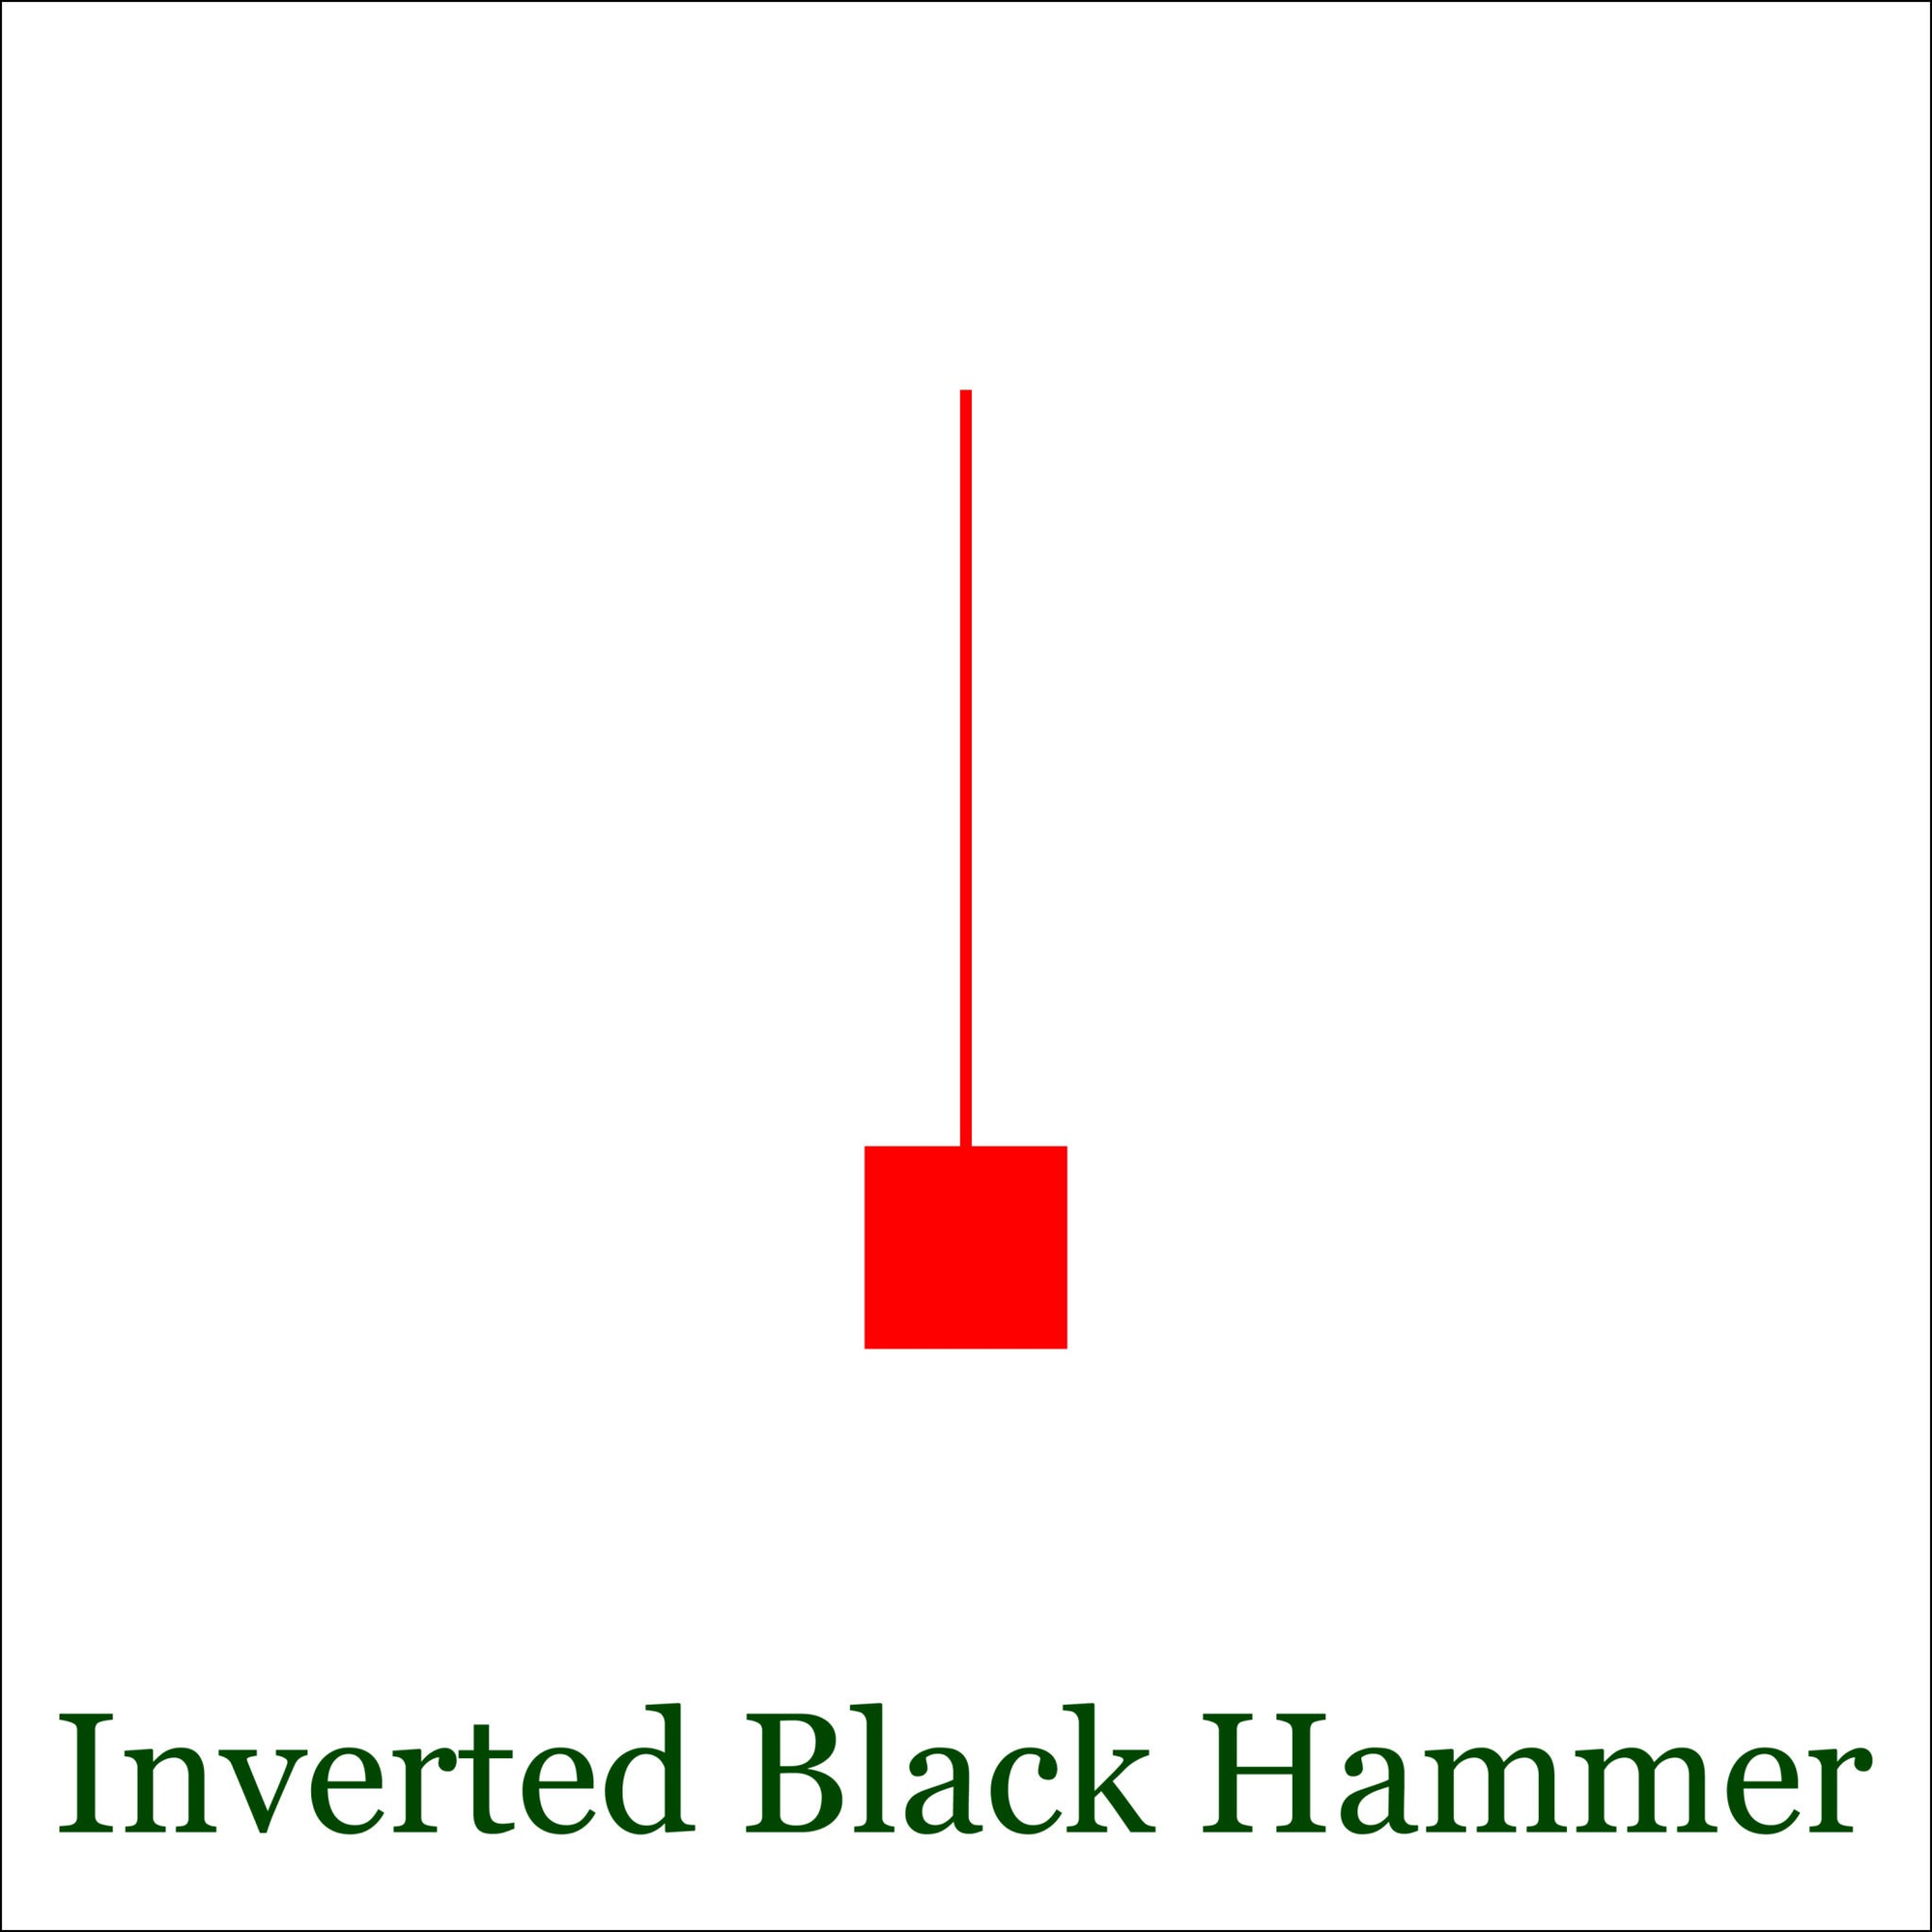
The Inverted Hammer is a single-candle bullish reversal pattern that forms at the bottom of an extended downtrend or prolonged pullback. Structurally identical in shape to the bearish Shooting Star, it features a small real body positioned at the lower end of the session's range, little to no lower shadow, and a long upper shadow that is at least two to three times the height of the real body. Although sellers pushed price back down toward the open before the close, the long upper wick reveals that buyers aggressively tested overhead resistance for the first time in the downtrend—proving that strong dip-buying demand has entered the market.
🔴 The Red Zone (The Prior Downtrend & Intraday Rejection)
- The Meaning: The market has been sliding under heavy bear control. While buyers make a sharp push upward during the session, sellers manage to drive prices back down near the open by the closing bell.
- The Move: Do not buy blindly on the candle's close. Even though buyers flexed their muscles intraday, the long upper wick means bears still managed to reject higher prices before the session ended. You must wait for next-day confirmation before declaring a reversal.
🟡 The Yellow Zone (The Inverted Hammer Print)
- The Meaning: The session officially closes, locking in a small body at the low and a tall upper wick (at least double the body length).
- The Move: Watch closely and prepare your setup. The Inverted Hammer is an early warning flare: it confirms that buyers are actively stepping up to challenge sellers. Place the asset on high alert and calculate your risk parameters, but keep your capital on the sidelines until the breakout candle prints.
🟢 The Green Zone (The Confirmation Candle Close)
- The Meaning: The candle immediately following the Inverted Hammer opens strong (or gaps up) and trades/closes decisively above the real body—or above the high—of the Inverted Hammer.
- The Move: Go! A confirmed close above the Inverted Hammer's body is your green light to enter a long position. Place your protective stop-loss just beneath the lowest price point of the pattern (the bottom of the Inverted Hammer's real body or lower wick).
🔍 Two Simple Signals to Watch
1. The 2:1 Upper Shadow Ratio & Green Body Edge
Look closely at the proportions and the close of the candle.
- The Logic: The upper shadow must be at least two times (ideally three times) the length of the real body, with little to no lower wick. While the candle can be green or red, a green Inverted Hammer (close above open) carries higher bullish conviction because the buyers managed to hold onto a net positive gain for the day despite the late pullback.
2. High-Volume Rejection on the Upper Wick
Check the volume bar accompanying the Inverted Hammer session.
- The Logic: An Inverted Hammer that prints on unusually high volume indicates institutional accumulation. Smart money stepped in to absorb all available supply at the bottom and tested higher price levels. When this occurs at a major historical support level or oversold oscillator extreme, the probability of a sharp bullish follow-through increases dramatically.
💡 The Simple Secret
Think of the Inverted Hammer as a reconnaissance mission behind enemy lines. The buyers aren't able to conquer and hold the hill on day one—they push deep into seller territory, get pushed back, but successfully probe the defenses and prove the enemy is weakening. The moment the next platoon arrives on day two and charges past that baseline, the bears are forced into a chaotic retreat, igniting an explosive short squeeze.

You Don't Have to Trade the Headline
A headline drops.
You see it.
Then another headline.
Then five accounts post about it.
Within three minutes, the market suddenly feels like a completely different place.
You were sitting there calmly five minutes ago.
Now you're refreshing your feed like a breaking-news correspondent.
"What does this mean?"
"Is this bullish?"
"Wait, now people are saying it's bearish."
And before you've even figured out what actually happened...
You're in a trade.
That's the Breaking News Reflex.
The problem isn't news.
News matters.
The problem is the tiny psychological gap between hearing information and needing to do something about it.
A headline appears and your brain immediately translates it into:
"TRADE."
You feel like you're late if you don't act.
So you chase the first move.
Price spikes.
You enter.
Then the market does what markets love doing:
It reverses.
Now you're sitting there wondering how a trade that looked so obvious thirty seconds ago suddenly looks ridiculous.
Because you weren't trading the market.
You were trading your reaction to the headline.
This gets even worse when everyone online is interpreting the news at the same time.
One person says it's bullish.
Another says it's bearish.
A third person has already posted a 27-tweet thread explaining the next six months.
You haven't even finished reading the headline.
Yet somehow you now have a macro thesis.
That's how fast borrowed conviction spreads.
And here's what experienced traders understand:
Information is not the same thing as opportunity.
A headline can matter without creating a trade you should take.
Sometimes the best response is simply:
"Interesting. Let's see what price does."
That feels painfully passive.
Especially when the market is moving fast.
But waiting for the reaction can tell you far more than trying to predict it.
Does price hold the move?
Does it reverse?
Does volume actually follow?
Does the breakout survive?
The market gets to process the news too.
Let it.
You don't get extra points for being the first person to click.
So next time a headline hits and your first instinct is to trade immediately, pause.
Ask:
"Do I have a setup... or do I have a headline?"
Because those are not the same thing.
One belongs in your trading plan.
The other belongs in your information feed.
And sometimes the smartest trade after breaking news is to sit there for ten minutes and let everybody else fight over the first five.
You might miss the first move.
Good.
Missing a move is cheap.
Chasing the wrong one can be very expensive.