Jobs Report Looms
....................................................................................................................


Good morning,
We’re starting Friday with a bit of a nervous climb. Despite a chaotic night in the Middle East, futures are leaning green—the Nasdaq is up 0.5% and the S&P 500 is gaining 0.3%. It’s a "wait-and-see" morning as investors try to figure out if the latest news is just a temporary spike in tension or the start of something much messier.
The "ceasefire" just got a reality check. Over the night, military clashes broke out near the Strait of Hormuz, sending oil prices jumping 2%. Both the U.S. and Iran are pointing fingers, but President Trump was quick to hit Truth Social, claiming our destroyers are fine and the "limited" action won't kill the overall truce. Still, with WTI crude creeping higher, the market is on edge—nobody likes a "limited" war that happens in the world's most important oil lane.
Today is "Jobs Friday," and the bar is low. At 8:30 a.m. ET, we get the official April jobs report. After last month’s surprise strength, economists are expecting a much cooler 65,000 new jobs. If the number hits that mark, it might actually be "good news" for the market, signaling that the economy is cooling enough to keep the Fed from getting aggressive, without sliding into a total freeze.
The "Global Pulse" is in the spotlight. While we wait for the labor data, we’re getting earnings from international heavyweights Toyota and Sony, alongside Brookfield Asset Management. These reports will give us a look at how global consumer demand and big-money investments are holding up while the geopolitical headlines keep flickering.
It’s a "eyes on the screen" Friday.
Between the naval clashes and the jobs data, the calm start to the morning could turn into a very loud day of trading by noon.

🌏 Global Stocks Surge Past Records as Markets Look Beyond War
Stock indices in Taiwan, South Korea, and Japan have clinced fresh record highs, demonstrating a powerful resilience to the ongoing Middle East conflict. Despite a heavy reliance on stalled oil imports, Asian markets are bouncing back from their March lows as investors increasingly separate geopolitical volatility from long-term corporate growth.
📉 Coinbase Slides on $400M Q1 Loss and Revenue Miss
Shares of Coinbase (COIN) tumbled Friday after the exchange reported a wider-than-expected $394 million net loss for the first quarter. While CFO Alesia Haas cited "genuinely tough" macro conditions and a 20% drop in crypto market cap, CEO Brian Armstrong highlighted a pivot toward an AI-driven "onchain economy" to diversify beyond spot trading.
📊 Morningstar: Tech Stocks Offer Best Value in Years After Stellar Q1
U.S. tech stocks are back in vogue following a dominant earnings season, with Morningstar analysis suggesting the sector is currently trading at a 5% discount to fair value. Despite long-standing "AI bubble" fears, analysts argue that record operating margins and robust cloud growth have made the "Magnificent Seven" attractive again.
🥇 Gold Heads for Weekly Gain as U.S.-Iran Ceasefire Holds
Spot gold climbed to $4,719 per ounce, on track for a 2.3% weekly gain as investors weigh the fragile peace process. Although both nations exchanged fire on Thursday in the "most serious test yet" of the ceasefire, the market remained optimistic after Tehran declared the situation had returned to normal.
🚗 Tesla Jumps as China Sales Surge 36% in April
Tesla shares rallied after Giga Shanghai reported 79,478 deliveries in April, marking its sixth consecutive month of year-on-year growth. The 36% annual surge in China-made EV sales helped the company buck a broader Q1 global downturn, signaling a stabilization in Tesla's most critical overseas market.
🛢️ Oil Set for Deep Weekly Drop on De-escalation Rhetoric
Energy prices are heading for a significant weekly loss as President Trump continues to stick to the ceasefire agreement despite recent skirmishes. The administration's insistence that the truce holds—and its dismissal of recent strikes as a "love tap"—has sustained market hopes for a finalized peace deal.
📉 Asian Stocks Fall as Clashes Strain Fragile Ceasefire
Regional markets retreated Friday, led by a 4.6% slide in SoftBank Group, as investors reacted to missile and drone attacks that triggered U.S. retaliatory strikes. While U.S. futures remained upbeat, the Nikkei 225 fell 0.2% from its all-time high as the threat of re-escalation in the Iran war dampened sentiment.

One Position Shouldn’t Control Your Entire Account

A setup looks strong. Confidence is high. So you go bigger than usual.
Maybe it’s one stock. One sector. One trade that feels “too good to miss.”
That’s where concentration risk begins.
When too much of your account depends on one idea, one bad move can do serious damage. It only takes one unexpected headline, one sharp reversal, or one bad day to hit everything at once.
Strong traders spread risk carefully. They avoid putting too much pressure on a single position. Even when they feel confident, they stay balanced.
Because trading is about surviving long enough for your edge to play out.
When your risk is distributed properly, losses become manageable. One trade no longer has the power to wreck your progress.
Some traders like learning how experienced market participants think about risk and positioning.
If that’s you, you can explore a few market reads here:

True Strength Index (TSI)
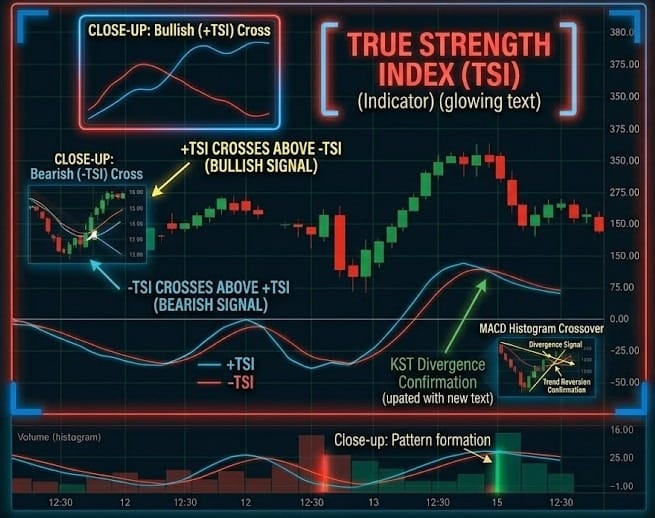
Developed by William Blau, the TSI is a double-smoothed momentum oscillator. While most oscillators (like RSI) are "jagged" and prone to false signals, the TSI uses two Exponential Moving Averages (EMAs) of the price change to create a very smooth line.
It is designed to show the "true" strength of a trend by filtering out the noise of daily price fluctuations.
🛠️ The Strategy Logic
Use these logical triggers to identify the core momentum of a move without getting distracted by minor price wiggles:
- IF: The TSI line (solid) crosses above the Signal line (dotted) while below the Zero line...
- THEN: A major bullish reversal is likely. Because the TSI is double-smoothed, this crossover is much more significant than a standard MACD cross. It indicates the "tide" has turned at a fundamental level.
- THEN: A major bullish reversal is likely. Because the TSI is double-smoothed, this crossover is much more significant than a standard MACD cross. It indicates the "tide" has turned at a fundamental level.
- IF: The TSI line crosses below the Signal line while in overbought territory (above +25)...
- THEN: The trend is exhausting. This is a high-probability "Take Profit" signal. It suggests that while the price may be moving sideways, the underlying momentum has already peaked and is rolling over.
- THEN: The trend is exhausting. This is a high-probability "Take Profit" signal. It suggests that while the price may be moving sideways, the underlying momentum has already peaked and is rolling over.
- IF: The TSI line crosses from negative to positive (above the Zero line)...
- THEN: The "Primary Trend" is now Bullish. This is the confirmation signal. Many traders use the Signal Line cross for entry and the Zero Line cross to add to their position (pyramiding).
- THEN: The "Primary Trend" is now Bullish. This is the confirmation signal. Many traders use the Signal Line cross for entry and the Zero Line cross to add to their position (pyramiding).
- IF: Price makes a higher high, but the TSI makes a lower high (Bearish Divergence)...
- THEN: The uptrend is "losing its soul." This is a classic warning of a trend collapse. The double-smoothing of the TSI makes these divergences much cleaner and easier to spot than on other oscillators.
- THEN: The uptrend is "losing its soul." This is a classic warning of a trend collapse. The double-smoothing of the TSI makes these divergences much cleaner and easier to spot than on other oscillators.
- IF: The TSI line is sloping upward but stays below the Zero line...
- THEN: You are seeing a "Counter-Trend" rally. Be cautious. This suggests the price is bouncing, but the overall market regime is still bearish until that zero line is breached.
💡 Pro Tip
The "Centerline" Secret: The TSI is unique because it is "boundless" in theory but tends to vibrate between +25 and -25 in practice. Unlike the RSI, which can stay overbought for weeks, the TSI is very sensitive to the rate of change. The most powerful trades occur when the TSI line is at an extreme (-25 or lower) and the Signal Line cross happens. This captures the "Snap-Back" effect where price has moved too far, too fast, and is mathematically forced to return to the mean.

Winning Too Much Can Mess You Up
Five green days in a row 📈
Everything feels smooth.
Setups are working.
Entries feel easy.
Confidence is high.
You start feeling “locked in.”
And that’s exactly when the danger starts.
Because slowly… quietly…
You stop respecting the process that got you there.
Maybe you skip your checklist once.
Maybe you rush an entry.
Maybe you take a setup that’s almost valid.
Nothing dramatic.
Just small shortcuts.
And since you’ve been winning?
Your brain lets it slide.
SUCCESS MAKES BAD HABITS FEEL SAFE.
That’s the blindspot.
Losses usually make traders more careful.
But winning streaks?
They make traders comfortable.
And comfort creates carelessness.
You stop preparing the same way.
You stop reviewing as deeply.
You start trusting instinct more than structure.
Not because you’re reckless.
Because you feel untouchable.
CONSISTENCY STARTS DYING THE MOMENT DISCIPLINE FEELS OPTIONAL.
This is why some traders give back strong weeks so quickly.
Not because the market suddenly changed.
Because they changed.
The rules became looser.
The standards dropped.
And eventually the market catches up.
One bad trade turns into two.
Then frustration kicks in because now you’re trying to protect the streak.
That pressure makes it even worse.
Professional traders understand something important:
A winning streak is not proof you can relax.
It’s proof the process is working.
Which means the last thing you should do… is abandon it.
Same checklist.
Same patience.
Same risk.
Even after five green days.
Especially after five green days.
Because great trading isn’t built on moments where you feel unstoppable.
It’s built on repeating the boring disciplines that made the streak possible in the first place.