Gold Hovers Near $4000
....................................................................................................................


Good morning,
A major weekend scare in the Middle East is easing up, and markets are clawing back into the green.
Nasdaq futures are up 1% and the S&P 500 is gaining 0.7% following news that the U.S. and Iran agreed to halt direct attacks after a weekend of heavy airstrikes along the Strait of Hormuz. While the geopolitical de-escalation has Brent crude hovering nervously at $73 a barrel, tech bulls are using the ceasefire to stage a comeback from a brutal 4.5% drop last week.
Safe-haven assets are feeling the shift. Gold (XAUUSD) is hovering between $4,020 and $4,100, finding footing at the $4,000 psychological floor after briefly snapping support at $4,024. Traders are split: short-term bulls are eyeing entries around $4,040–$4,050 to target $4,280, while bears warn of a broader downward trend that could push prices to $3,850 if current supports fail.
It’s a hopeful start to a short week. The immediate threat of a wider war has stepped back, giving tech a clean shot at a recovery and gold a key baseline to test before the big jobs data hits on Thursday.

🕊️ U.S. and Iran Agree to Pause Hostilities and Resume Peace Talks
Washington and Tehran have officially agreed to pause active border hostilities and resume technical diplomatic talks following a chaotic weekend spike in violence. The de-escalation follows targeted U.S. defensive strikes against Iranian military assets, which were executed in direct retaliation for a drone and missile attack on a supertanker transporting Qatari crude near the critical shipping channel.
📊 European Stocks and U.S. Futures Perk Up as Middle East Hostilities Freeze
European equity indexes and Wall Street stock futures ticked into positive territory on Monday morning as global markets reacted with relief to the paused fighting. Financial desks are moving back into risk-on assets, using the temporary stabilization in the Persian Gulf to recalibrate positions ahead of a highly active, holiday-shortened macro calendar.
🛢️Oil Moderates Near $73 as Washington and Tehran Head to Doha Meeting
International energy benchmarks pared an early morning spike, with Brent crude moderating near $73.39 a barrel and West Texas Intermediate settling near $70. Crude prices surged initially after the weekend attack on a Qatari vessel near the Strait of Hormuz, but quickly cooled off after reports surfaced that senior U.S. and Iranian negotiators have agreed to meet on Tuesday in Doha to salvage the ceasefire framework.
🇰🇷 South Korea Deploys $576B Industrial Blitz with Samsung and SK Hynix
South Korean President Lee Jae Myung has unveiled a massive 900 trillion won ($576 billion) mega-scale industrial strategy centered on securing absolute dominance in artificial intelligence and semiconductor manufacturing. The state-backed initiative taps domestic hardware powerhouses Samsung Electronics and SK Hynix to rapidly construct decentralized manufacturing clusters and insulate the country's technology supply chain.
🤖 Intel CEO's Alternative AI Accelerator Bet SambaNova Targets $10B Valuation
AI chip startup SambaNova Systems—where Intel CEO Lip-Bu Tan serves as Executive Chairman—is in advanced discussions to secure up to $1 billion in fresh capital at a staggering $10 billion implied valuation. The funding represents a five-fold valuation explosion in just four months, highlighting insatiable institutional appetite for energy-efficient reconfigurable dataflow chips designed to challenge Nvidia's absolute dominance in inference processing.
📊 Wall Street Eyes Solid First Half as Focus Pivots to Critical Jobs Data
Major U.S. equity benchmarks are on track to wrap up a resilient first half of 2026, with the benchmark S&P 500 up over 7% year-to-date despite experiencing severe tech-led downside volatility in June. Ahead of the holiday break, market participants are keeping a laser focus on upcoming nonfarm payroll data to gauge whether economic strength will force the Federal Reserve into a near-term interest rate hike.
📈 Baidu Soars 7% as Chip Division Kunlunxin Eyes $50B Hong Kong Listing
Shares of Baidu jumped sharply on reports that its independently operated AI semiconductor subsidiary, Kunlunxin, is targeting a blockbuster $50 billion initial public offering on the Hong Kong Stock Exchange. The massive infrastructure play has drawn intense financial interest, with reports revealing that prospective IPO buyers are being directly incentivized to purchase Kunlunxin’s enterprise processors alongside their equity allocations.

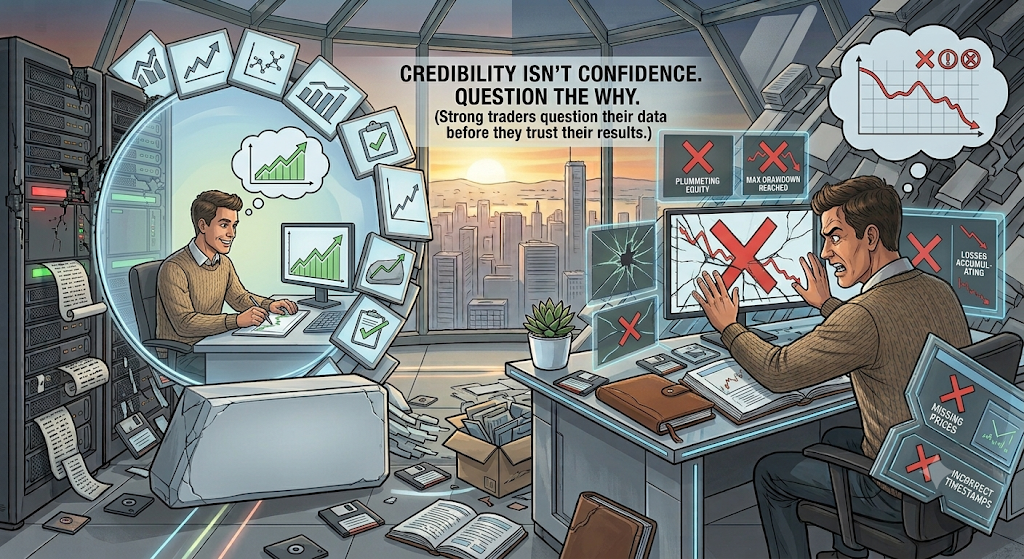
The Market Doesn’t Care What Worked Last Year
You find a strategy with an amazing backtest.
It would have made money for months… maybe even years.
So you assume it will keep working.
That’s the trap.
Markets change. Trends become ranges. Volatility rises and falls. What worked in one environment can struggle in another.
Many traders build strategies that fit the past perfectly but can't handle the future. They tweak every rule until the backtest looks flawless, only to watch the strategy fall apart in live markets.
Strong traders don't chase perfect backtests. They build strategies that can adapt to different conditions. They accept that no system wins all the time, and they avoid optimizing for yesterday's market.
Because the goal isn't to predict history.
It's to survive what's next.
When you stop trying to build the perfect historical strategy, you start building one that's more likely to work in the real world.
Robust beats perfect.
Markets evolve, and so do trading ideas. Exploring different perspectives can help you think beyond what worked yesterday.
Discover a few market newsletters here:

Pivot Points
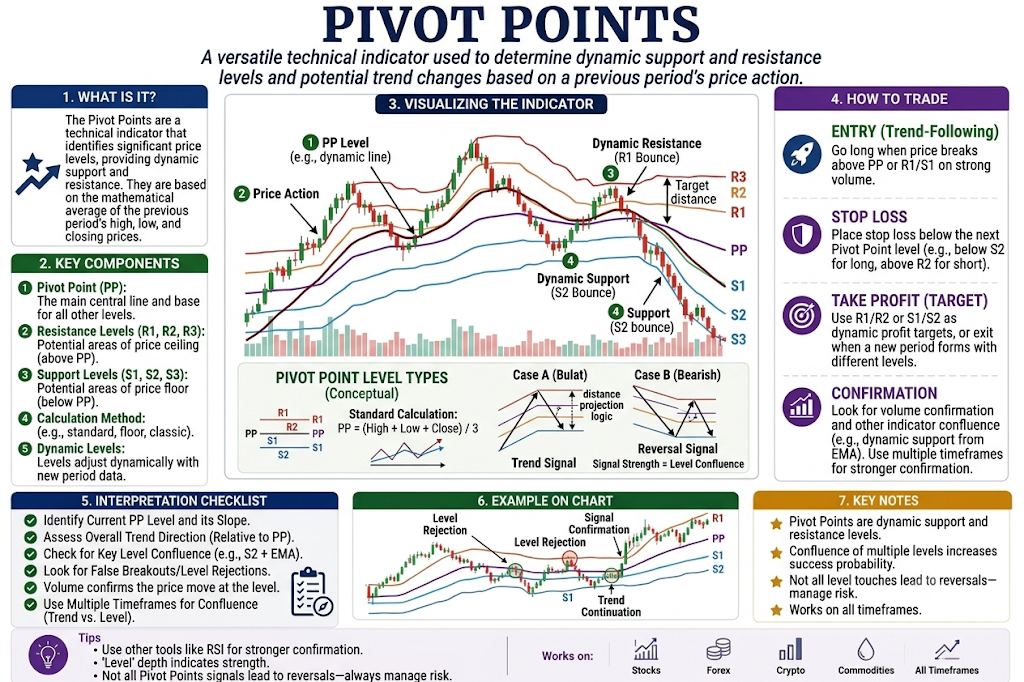
Pivot Points act like a hidden map drawn directly onto your chart at the start of every trading day. Using a mathematical formula based on yesterday’s high, low, and closing prices, the tool generates a central anchor line and several predictable floor and ceiling levels. It shows you exactly where the market is likely to change direction.
🔴 The Red Zone (The Resistance Ceilings)
The Meaning: The price rallies up and approaches the lines labeled R1, R2, or R3 above the center anchor. These are predetermined supply zones where sellers are waiting.
The Move: Caution. The price is entering a heavy ceiling area. Avoid buying here; instead, look for the price to stall, as this is the prime zone where the market runs out of steam and reverses downward.
🟡 The Yellow Zone (The Central Pivot Line)
The Meaning: The price is hovering right around the main central line, labeled PP (Pivot Point).
The Move: Watch closely. This central line is the ultimate balance point for the day. If the price stays above the PP, the market sentiment is bullish for the day. If it stays below the PP, the sentiment is bearish. Treat it as your daily trend divider.
🟢 The Green Zone (The Support Floors)
The Meaning: The price drops heavily and approaches the lines labeled S1, S2, or S3 below the center anchor. These are predetermined demand zones where buyers are waiting.
The Move: Get ready. The asset has hit a major floor area. This is where panic selling usually hits a brick wall, making it an excellent high-probability zone to watch for a fresh upward bounce.
🔍 Two Simple Signals to Watch
1. The Breakout Extension
Sometimes the market opens with massive news or extreme volume and blasts straight through R1 or S1 without even slowing down.
- The Logic: If the price cleanly breaks and closes past the first level, that level flips roles. A broken R1 ceiling instantly becomes a new floor. The market will then usually sprint toward the next line on the map (R2 or S2).
2. The Overextended Reversal (R3 & S3)
The third levels (R3 and S3) represent extreme, rare market boundaries for a single day.
- The Logic: It is very unusual for a market to move past R3 or S3 in a normal trading session. If the price manages to reach these outer edges, it is severely overstretched. Watch for an immediate, sharp snap-back move back toward the center yellow line.
💡 The Simple Secret
Think of Pivot Points as a predictive GPS. Because these lines are calculated before the trading day even begins, they do not lag or change based on current price movement. Millions of professional traders and automated algorithms look at these exact same price levels daily, which is why the market so frequently pauses, bounces, or reverses the very second it touches them.

The Market Didn't Change
You start the day with a plan.
You've done the work.
Your watchlist is ready. Your levels are marked. You know exactly what you're looking for.
Then you make one tiny mistake.
You open social media.
Suddenly, nobody is talking about the stocks you've been watching.
Now it's all AI.
Or uranium.
Or defense stocks.
Or whatever sector decided to become the internet's favorite obsession this week.
Your feed is flooded with screenshots.
"Up 18%."
"Caught the whole move."
"Easy money."
Within minutes, something strange happens.
The stocks you spent all weekend researching start looking... boring.
Your watchlist hasn't changed.
The market hasn't changed.
Only your attention has.
So you abandon your plan.
You start pulling up charts you've never looked at before.
Reading posts from people you've never heard of.
Trying to understand a move that's already halfway over.
And now you're making decisions from the worst possible position:
You're informed enough to feel confident...
...but not informed enough to understand the risk.
This is one of the biggest hidden costs of social media.
It constantly convinces you that the best opportunity is happening somewhere else.
There's even a name for it in psychology: the grass-is-greener effect.
Whatever you're looking at suddenly feels less exciting than what everyone else is posting.
The result?
You become a tourist instead of a trader.
One week you're an energy expert.
The next week you're chasing biotech.
By Friday you've somehow convinced yourself you're a semiconductor specialist.
Meanwhile, the edge you spent months developing never gets enough consistency to compound.
Professional traders know something that's surprisingly boring:
You don't have to trade the hottest story to have a profitable month.
Sometimes the biggest edge comes from staying with the markets you actually understand while everyone else is running toward the latest shiny object.
The next time an entire sector takes over your feed, pause before you click.
Ask yourself:
"Am I interested because this fits my strategy... or because everyone else suddenly can't stop talking about it?"
Those are two completely different reasons to take a trade.
One comes from preparation.
The other comes from fear of being left out.
And fear has a remarkable ability to disguise itself as curiosity.
The market will always have a new obsession next week.
Your job isn't to chase every one of them.
It's to build the discipline to let other people have trades that were never yours in the first place.