Cerebras Biggest IPO Debut
....................................................................................................................


Good morning,
After a massive Thursday where stocks were hitting all-time highs, we’re seeing a pretty sharp pullback this Friday morning. The Nasdaq is leading the slide, down 1.2%, with the S&P 500 and Dow following suit. The vibe has shifted from "growth mode" to "inflation worry" as the 10-year Treasury yield climbs above 4.5%. When yields go up like that, it usually sucks the air out of the room for stocks.
The China summit is over, but the "War Fog" hasn't lifted. President Trump wrapped up his meeting with Xi Jinping and is heading back to D.C. While he secured some solid business deals for giants like Boeing and Nvidia, the big hope—that China would help end the Iran war—didn't really happen. Since there’s no clear path to peace in the Middle East, the market is bracing for energy costs to stay high, which is exactly why inflation feels so "sticky" right now.
AI is still the one bright spot. Even with the market dropping, Figma shares jumped after-hours because their earnings showed that the AI boom is still driving huge demand. It’s a reminder that while the geopolitical stuff is messy, the tech revolution isn't stopping.
On the calendar today: We’re keeping an eye on earnings from Mizuho Financial and Sigma Lithium. These results will give us a better look at how the banking and battery sectors are holding up with interest rates this high and oil still causing drama.
The record highs were fun, but with yields rising and the Middle East still on edge, traders are taking some money off the table before the weekend.

🚀 Cerebras Surges 70% in 2026’s Biggest IPO Debut
Cerebras Systems (CBRS) made a stunning public debut, with shares skyrocketing 68% to close at $311.07. The Nvidia competitor saw its market cap touch $70 billion as the stock nearly doubled its $185 IPO price, underscoring the massive investor appetite for alternative AI hardware providers.
📊 Strive Rallies on Daily Dividend Plan Despite $265M Loss
Strive (ASST) shares climbed nearly 6% after announcing a novel daily dividend payout for its Series A Perpetual Preferred stockholders. The move effectively overshadowed a reported $265 million net loss in Q1, as the market cheered the aggressive capital return initiative.
📈 Nvidia Tops $5.7T as U.S. Clears H200 Sales to China
Nvidia’s valuation hit a record $5.7 trillion on Thursday, fueled by reports that the U.S. Commerce Department cleared major Chinese firms—including Alibaba and Tencent—to purchase the H200 chip. The stock surged 4% as the tech sector rallies ahead of Nvidia’s highly anticipated earnings report next week.
📉 Kospi Plunges 6% as Xi Warns of Conflict Over Taiwan
South Korea’s Kospi retreated sharply from record highs, dropping over 6% after Chinese President Xi Jinping warned that Taiwan tensions could trigger "clashes and conflicts" with the U.S. The geopolitical friction triggered a massive sell-off in heavyweight tech names, dragging the Nikkei down 2% and sending gold prices sliding 1.4%.
🏛️ European Stocks Fall as Starmer Faces Leadership Challenge
European markets opened lower Friday as political instability in Westminster rattled investors. Prime Minister Keir Starmer is facing a potential leadership challenge following Labour’s local election losses, adding a layer of political risk to a market already grappling with resurgent inflation fears and rising oil prices.
💰 TSMC Trims Stake in Vanguard with 152M Share Sale
TSMC announced plans to sell up to 152 million shares of Vanguard International Semiconductor (VIS) via a block trade. The sale will reduce TSMC’s holding to approximately 19%, though the company stated it has no further plans to divest VIS shares for the foreseeable future.
₿ Gemini Soars 15% on Strong Q1 and $100M Winklevoss Bet
Gemini Space Station (GEMI) shares surged 15% in after-hours trading following a 42% jump in Q1 revenue. Sentiment was bolstered by a $100 million strategic investment from Winklevoss Capital, settled in bitcoin at a premium price of $14 per share—a major vote of confidence in the platform's new derivatives clearing license.

Small Fees Quietly Kill Accounts
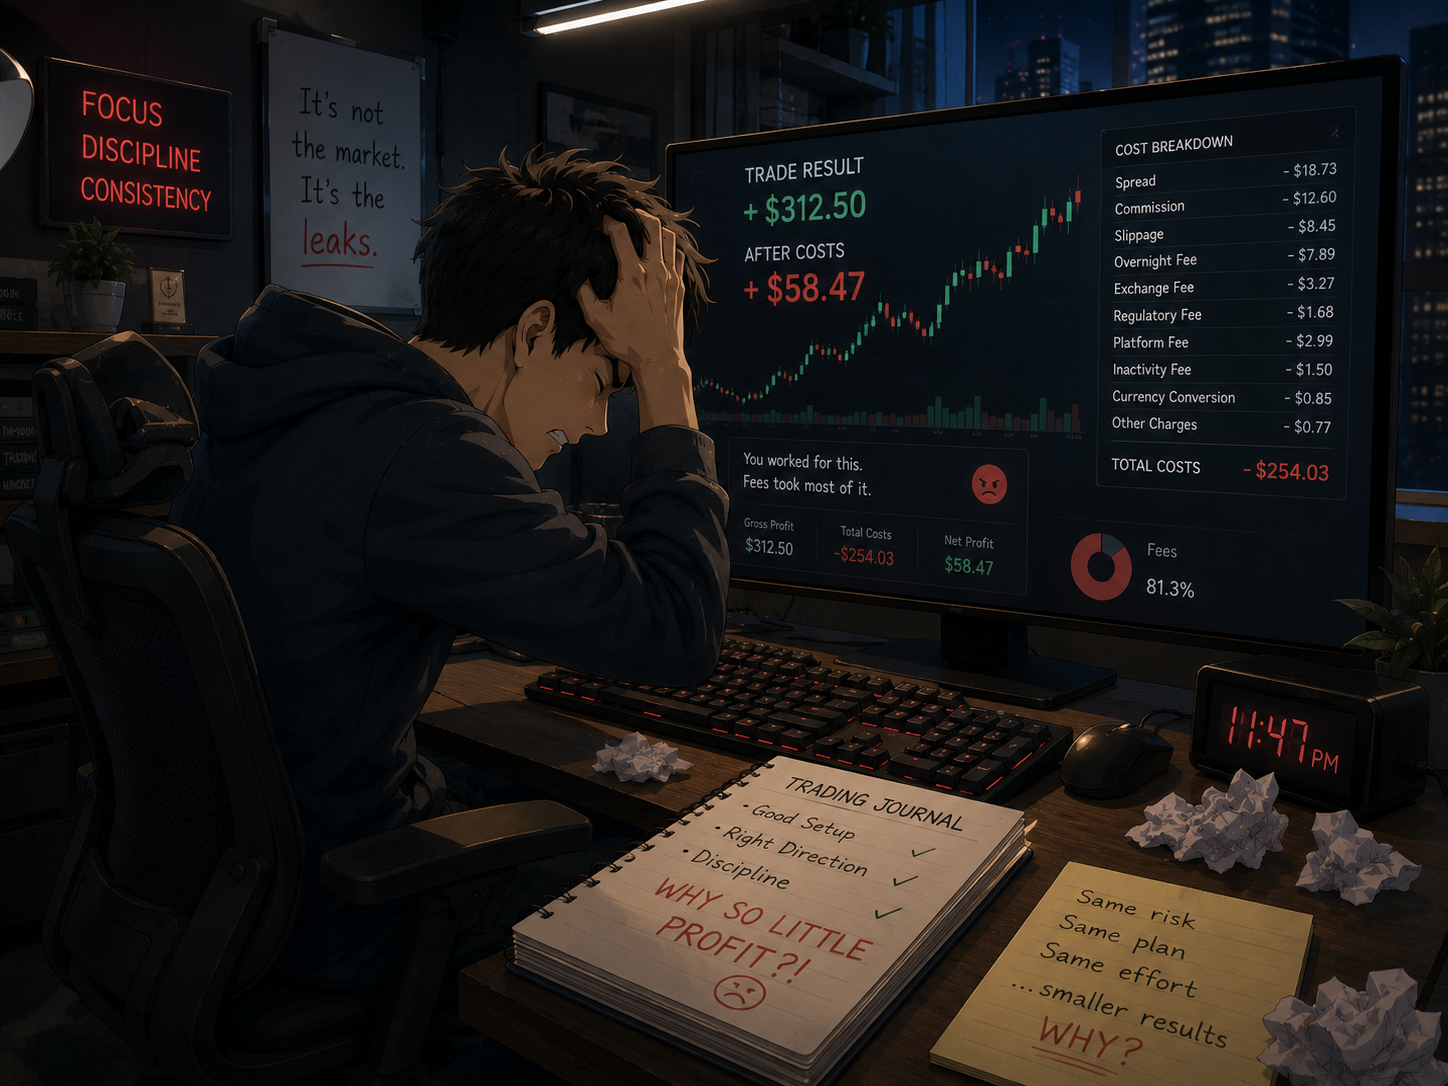
You enter the trade. The setup looks good. The move goes your way.
But the profit still feels smaller than expected.
That’s usually where hidden costs show up.
Spreads. Commissions. Overnight fees. Slippage. They seem small individually, but over time they add up fast, especially for traders who trade frequently.
Many traders focus only on direction. They forget that trading has costs attached to every click.
Strong traders pay attention to execution costs. They know which markets have wider spreads, which times are more expensive to trade, and how fees affect their strategy over time.
Because a strategy that works before costs can fail after costs.
When you understand what you’re really paying, your trading becomes more accurate.
You stop overtrading. You choose setups more carefully.
Costs matter more than most traders realize.
Some traders like learning about the less obvious factors that impact trading performance over time.
If that’s you, you can explore a few market reads here:

Double Bottom
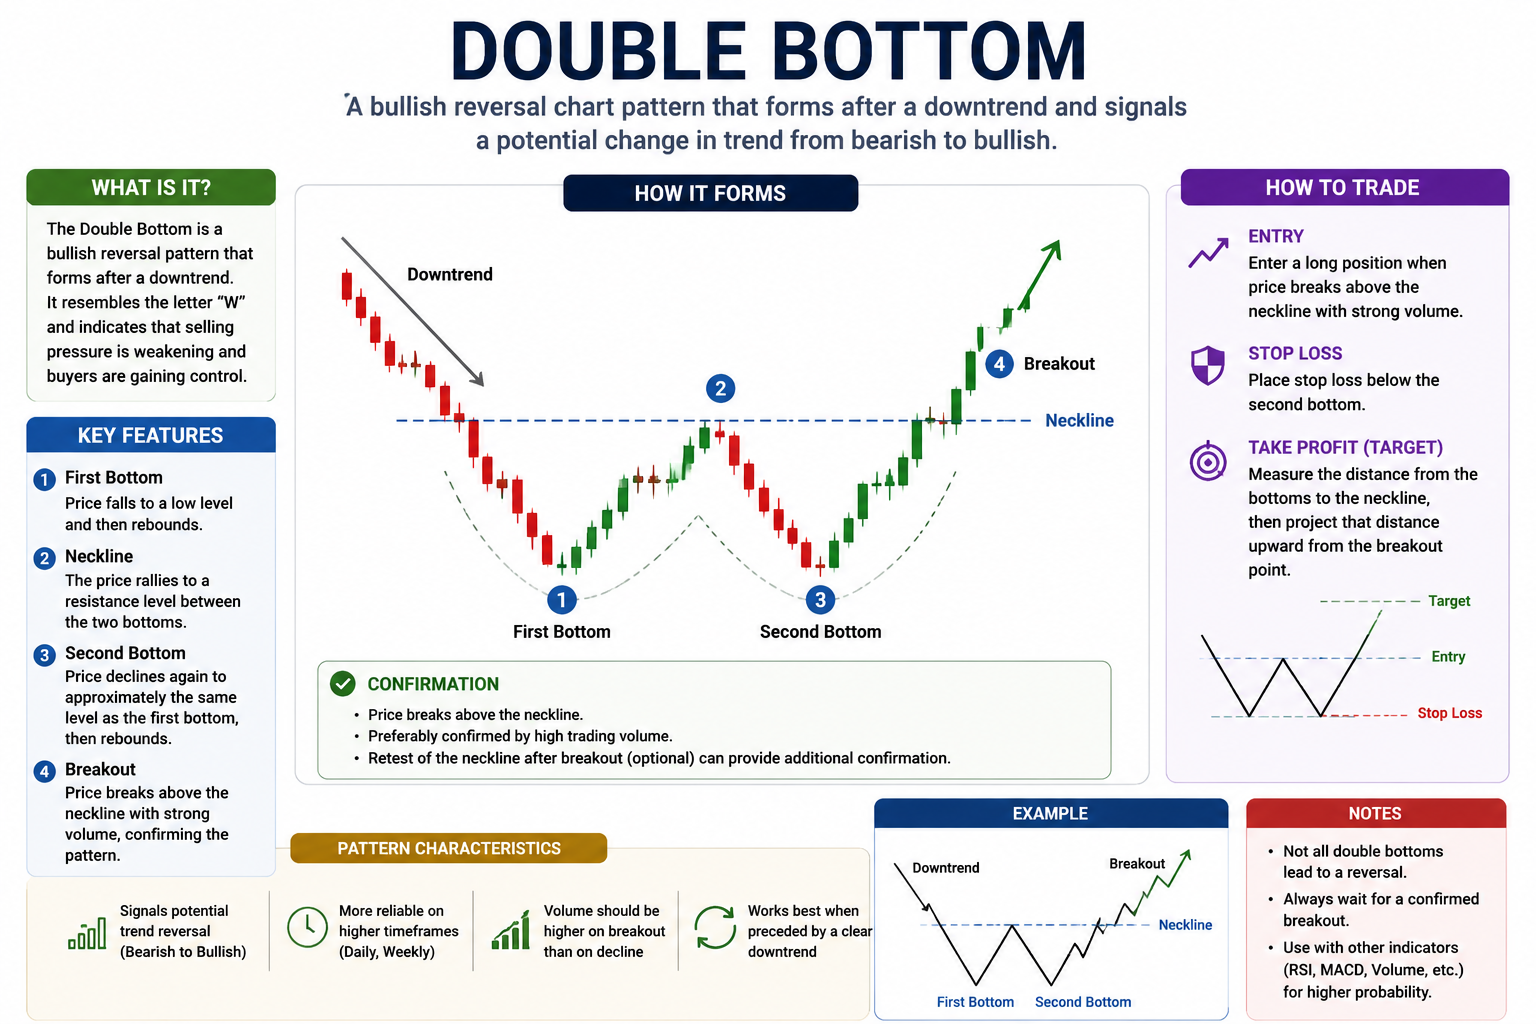
The Double Bottom is a classic "W" shaped pattern that signals a major downtrend has hit a floor. It shows that sellers tried twice to push the price lower but failed both times, letting the buyers take over.
🔴 The Red Zone (The First Drop)
The Meaning: Price falls sharply and hits a new low. At this point, the market looks weak, and it seems like the price will keep dropping forever. The Move: Wait. This is just the first "leg" of the pattern. You are looking for where the sellers finally run out of steam.
🟡 The Yellow Zone (The Middle Bounce)
The Meaning: Price bounces up slightly (forming the middle of the "W") but then gets rejected and falls back down toward the first low. The Move: Watch closely. This middle peak is called the Neckline. It is the boundary that the buyers must eventually break to prove they are back in control.
🟢 The Green Zone (The Second Bounce & Break)
The Meaning: Price hits the same low as before but refuses to go lower. It then rallies and blasts through the Neckline. The Move: Go! This is the signal that the "floor" is solid. The break above the neckline confirms that the sellers are exhausted and a new upward trend has begun.
🔍 Two Simple Signals to Watch
1. The Twin Lows
The two "bottoms" don't have to be exactly perfect, but they should be very close to the same price level.
- The Logic: This shows that there is a "Wall of Money" (Support) at that price. No matter how hard the bears push, they can't get past it.
2. The Volume Spike
Watch the amount of trading (Volume) when the price breaks above the Neckline.
- The Logic: If the break happens with a lot of volume, it means the "Big Players" are buying. If volume is low, the breakout might be a "fake-out" that fails.
💡 The Simple Secret
The "W" shape is essentially a test of strength. The market tested the bottom twice, and the bottom held firm. A common rule for targets is to measure the distance from the bottom to the neckline and add that same distance to the top of the breakout.

You Keep a Journal… But Never Use It

A lot of traders love the idea of journaling.
Spreadsheets.
Screenshots.
Entry notes.
Emojis next to winning trades 😂
Every trade gets logged like it’s going into a museum archive.
Very professional.
But here’s the uncomfortable question:
When was the last time you actually sat down and STUDIED your journal?
Not updated it.
Not added another screenshot.
Actually reviewed it.
Because for many traders, the journal becomes another productivity illusion.
It FEELS like improvement work.
But nothing changes.
Same mistakes.
Same impulsive entries.
Same emotional exits.
Just documented beautifully this time 📉
That’s the trap.
Data alone doesn’t improve performance. Reflection does.
A trading journal is not supposed to be a scrapbook of your market adventures.
It’s supposed to expose patterns you can’t see in real time.
Patterns like:
- Taking worse trades after losses
- Cutting winners early on Fridays
- Oversizing when emotional
- Ignoring your best setups out of fear
But none of that matters if the journal never gets revisited.
Imagine going to the gym every day… but never increasing weight, fixing form, or checking progress.
You’re active.
But not evolving.
That’s what happens when traders collect data without analysis.
And honestly?
Reviewing your journal is uncomfortable.
Because eventually you stop seeing “bad luck”…
…and start seeing your behavior clearly.
That part stings.
You realize:
- The market wasn’t always the problem
- Your rules weren’t as consistent as you thought
- Some losses were completely avoidable
But THAT is where growth begins.
Not in logging the trade.
In confronting it.
Good traders use journals differently.
They don’t just record trades.
They investigate themselves.
They look for emotional patterns.
Decision patterns.
Environmental patterns.
Because over time, your journal should become less about:
“What did the market do?”
…and more about:
“What do I keep doing?”
So here’s something practical:
At the end of every week, don’t just total your P&L.
Review:
- Your best trade
- Your worst trade
- Your most emotional decision
- One mistake that repeated itself
Then ask:
“What would next week look like if I actually fixed this one thing?”
That’s where the value is.
Because a journal you never study is just proof you showed up.
A reviewed journal is proof you’re evolving.