Bitcoin Rockets to $77K
....................................................................................................................


Good morning!
Futures are inching higher across the board—the tech-heavy Nasdaq is up 0.4%, while the S&P 500 and Dow are both up a modest 0.2%. But don't let the green fool you: Wall Street is still staring down weekly losses after a rough few sessions. High borrowing costs in the bond market have put heavy pressure on big-spending tech favorites like Nvidia and SpaceX, making investors think twice before jumping back in with both feet.
The Treasury Department tried to step in and calm things down yesterday by expanding government bond buybacks beyond $4 billion per issue to push yields lower. Treasury Secretary Scott Bessent even went on TV to reassure everyone that current bond yields don't make sense. But the market's relief lasted only a heartbeat before yields snapped right back up, showing that investors aren't easily convinced by quick fixes.
Now, all eyes are shifting to Washington and the Middle East. Traders are waiting for Monday, when Bessent is set to reveal a new plan to economically isolate Iran. With President Trump threatening massive economic penalties on any nation trading with Tehran, all eyes are on major oil buyers like China.
Throw in next week’s monster events—including Nvidia’s earnings and the Fed’s Jackson Hole conference—and today feels like the calm before another major storm. For now, investors are wrapping up the week by watching fresh manufacturing numbers and retail earnings from BJ's Wholesale to see just how well the everyday economy is holding up.

📉 Global Stocks Head for Worst Week Since Mid-July
Global equity indices were set for their steepest weekly decline since mid-July on Friday as persistent pressure across sovereign bond markets rattled investors. Heightened diplomatic gridlock in the Persian Gulf kept crude oil elevated near one-month highs, keeping macro inflation worries at the forefront.
🛢️ Oil Poised for Second Weekly Gain on Iran Pressure
Crude prices eased slightly Friday but remained on course for a second consecutive weekly advance as hopes for a swift Strait of Hormuz reopening continued to fade. Upward price momentum was reinforced after U.S. officials pledged to unleash the "toughest sanctions in history" to economically isolate Tehran.
₿ Bitcoin Leaps Past $75,000 as Asian Crypto Rally Expands
Bitcoin surged past $75,000, rising more than 4% in early Asian trade to extend an aggressive multi-day advance. The rally accelerated after the U.S. Treasury revealed unexpected debt intervention plans aimed at cooling long-term government bond yields, driving liquidity into risk assets.
💾 Broadcom Seeks Over $60B in Debt for Anthropic AI Deal
Broadcom is in active negotiations with lenders to raise more than $60 billion in debt financing. The massive capital package is designed to fund custom AI semiconductor hardware pipelines and deployment programs benefiting Anthropic PBC and other enterprise clients.
🥇 Gold Eyes Third Weekly Gain on U.S. Debt Buyback Shift
Spot gold trended toward a third consecutive weekly gain as market participants absorbed the U.S. Treasury's unexpected ramp-up in long-term debt buybacks. The move heightened sovereign debt load concerns, reinforcing bullion’s macro hedge and safe-haven appeal.
🇰🇷 Samsung Plans Historic $80B Return After SK Hynix Buyback
Samsung Electronics announced a massive capital return program projected between 90 trillion won and 110 trillion won ($65.1B to $79.52B) for 2026, marking the largest shareholder package ever by a South Korean company following a similar buyback move from rival SK Hynix.
🤖 Anthropic Prepares IPO Filing Targeting Multi-Billion Valuation
AI startup Anthropic is preparing to file its public IPO registration paperwork as early as the end of this month. According to Bloomberg, the company is aiming to match or eclipse SpaceX’s $75 billion listing, offering the market its first comprehensive look at its financials and revenue run rate.

Your Strategy Won’t Work Forever
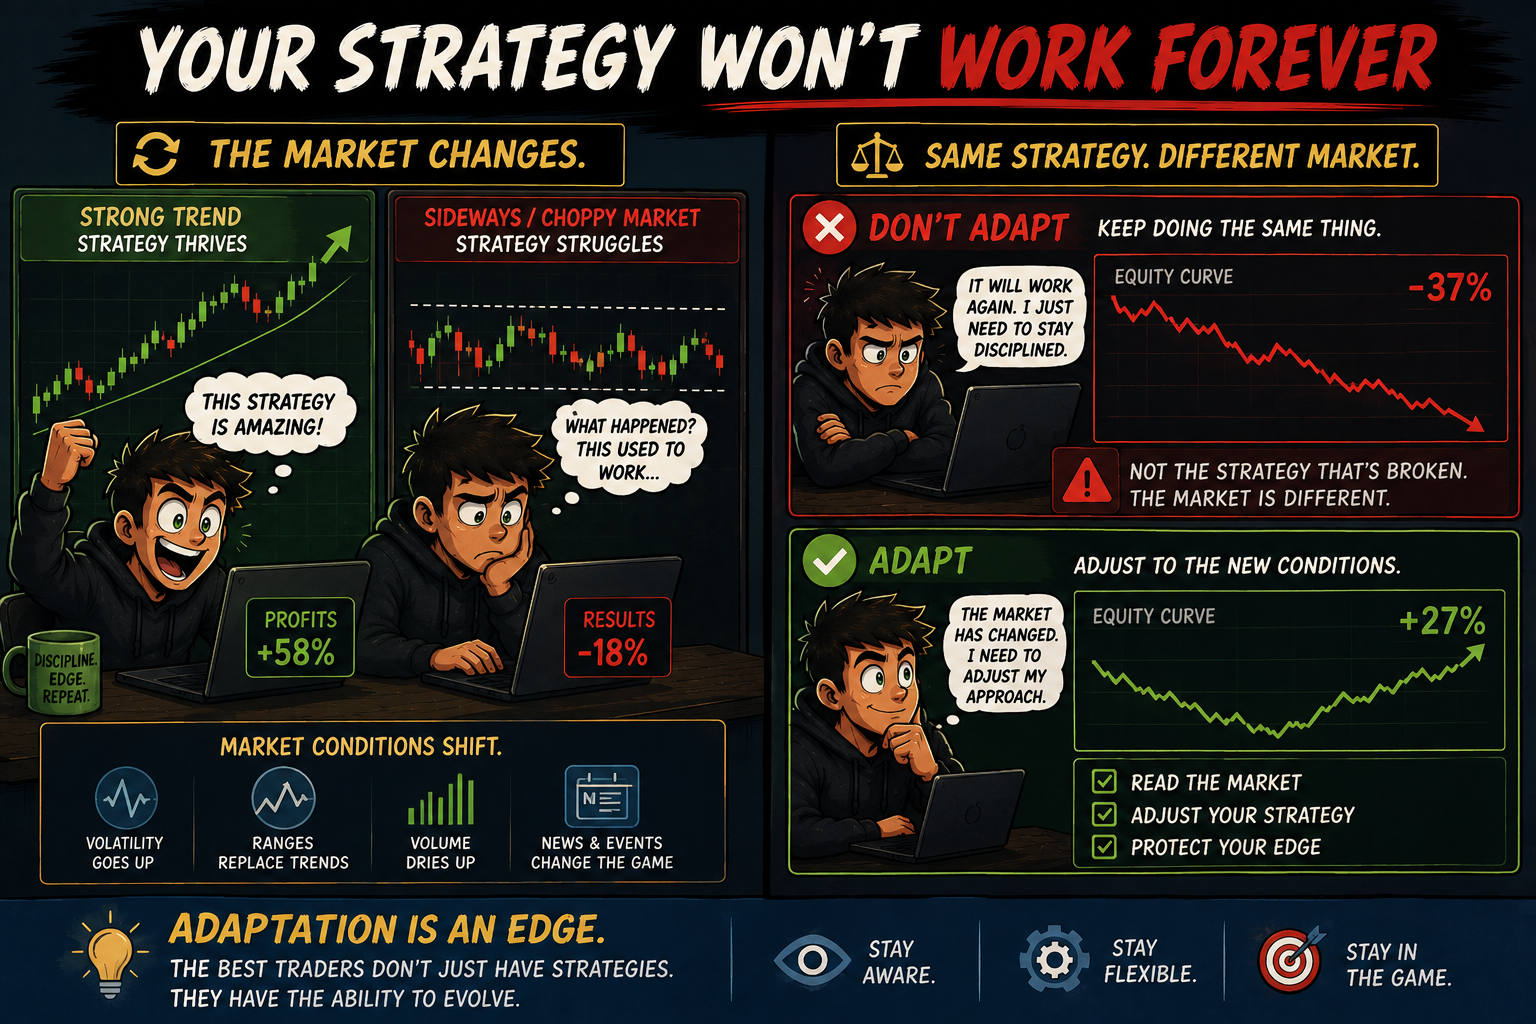
The market changes.
A strategy that worked beautifully in a strong trend can struggle when conditions turn sideways. A setup that worked in low volatility can behave very differently when markets start moving aggressively.
Yet many traders keep doing the same thing.
They assume the strategy has stopped working when the real problem is that the market has changed.
That's where adaptation matters.
Strong traders don't abandon their strategy every time they hit a losing streak. They have a process for identifying when market conditions have changed and deciding whether their approach still fits.
They watch volatility. They pay attention to trend strength, liquidity, and broader market behavior. If the environment changes, they adjust their expectations, position sizing, or trading frequency instead of forcing the same setup.
Because adapting doesn't mean constantly changing your rules.
It means knowing when the conditions have changed enough to require a different approach.
The goal isn't to build a strategy that works in every market.
It's to build a process that knows what to do when the market changes.
Markets don't stay the same for long. Learning how different traders respond to changing conditions can help you build a more flexible process of your own.
Explore a few market newsletters here:

The Bullish Engulfing Pattern
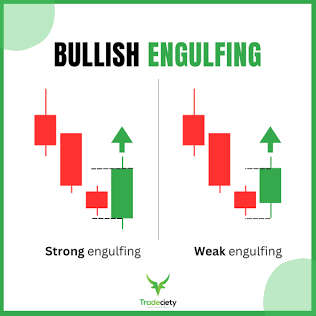
Bullish Engulfing Candlestick Reversal Structure. Source: Tradeciety
The Bullish Engulfing is a high-conviction, two-candle reversal pattern that forms at the bottom of an extended downtrend or pullback. It occurs when a small bearish (red) candle is immediately followed by a large, powerful bullish (green) candle whose real body completely "engulfs" or covers the real body of the previous candle. It signals an aggressive, sudden power shift where buyers overwhelm sellers in a single session.
🔴 The Red Zone (The Prior Downtrend & Small Red Candle)
The Meaning: The market is sliding lower under seller control, culminating in a small red candle. Sellers are still in charge, but the small candle size reveals that their downward momentum is starting to stall.
The Move: Wait. Do not anticipate the bottom. Until the second candle forms and closes, the downtrend is still technically intact.
🟡 The Yellow Zone (The Open Gap & Intraday Push)
The Meaning: The next candle opens at or below the prior candle's close (sometimes with a small gap down), but aggressive buyers instantly step in and drive the price relentlessly upward throughout the session.
The Move: Watch closely. Monitor the candle as it develops. The buyers are flexing massive strength, but the pattern is not valid until the candle officially completes its close above the open of the prior red candle.
🟢 The Green Zone (The Full Engulfing Close)
The Meaning: The green candle closes firmly above the opening price and high of the preceding red candle's body, fully consuming it.
The Move: Go! A confirmed close on the engulfing candle is your official green light to enter a long position. Place your stop-loss just beneath the low of the green candle to protect your trade.
🔍 Two Simple Signals to Watch
1. Relative Candle Size & Body Overlap
Compare the physical size of the green engulfing candle to the candles preceding it.
- The Logic: A strong engulfing pattern occurs when the green candle's body dwarfs the red candle (as seen in the "Strong engulfing" diagram above). If the green candle is large enough to engulf two or three prior red candles at once, it shows overwhelming institutional accumulation.
2. The Volume Confirmation Surge
Pay attention to the volume bar on the green engulfing candle compared to the prior few bars.
- The Logic: The engulfing candle must print significantly higher volume than the red candle before it. High volume confirms that large institutions have stepped in with massive capital to reverse the trend, rather than a low-liquidity retail bounce.
💡 The Simple Secret
Think of a Bullish Engulfing pattern as a complete hostile takeover on the battlefield. The sellers push the price down to open the day, but the buyers not only absorb all that supply—they push all the way past where the sellers started yesterday and win the entire territory. When this happens at a major support floor or moving average, it marks one of the highest-probability trend reversals in technical analysis.

Of Course It Was Obvious. The Candle Had Already Closed.
There's a particular kind of confidence that only appears after the trade is over.
You pull up the chart.
Price broke resistance.
You stare at it for a few seconds.
"There. That was the entry."
You scroll back.
"And here. Perfect pullback."
Another section.
"Easy short."
Suddenly, the whole market looks incredibly simple.
Every move has a reason.
Every level looks obvious.
You start feeling pretty good about your ability to read price.
Until tomorrow.
The market opens.
A setup appears that looks almost identical.
You hesitate.
The breakout runs without you.
Then another setup comes along.
You enter.
It immediately pulls back.
Now you're questioning everything.
"Why doesn't live trading look this easy?"
Because you're comparing real-time uncertainty with a chart that has already revealed the answer.
That's not a fair fight.
When you're replaying history, you know what happens next.
You don't have to worry about the fake breakout that happened five candles later.
You don't feel the pressure of having money at risk.
You don't have to choose between entering now or waiting for confirmation.
Your brain gets to work backwards.
And working backwards is ridiculously easy.
That's why hindsight can create a dangerous illusion of skill.
You replay enough charts and eventually start believing:
"I would've caught that."
Would you?
There's only one way to know.
Would you have entered before the breakout was confirmed?
Would you have held through the pullback?
Would you have taken the trade knowing it could fail?
Would you have followed your stop if it did?
Those are the decisions that matter.
Not the beautiful arrow you draw afterward.
I once heard a trader say, "I can explain almost every move after it happens. I just can't seem to trade them live."
That's actually a very important realization.
He didn't have a prediction problem.
He had a decision-making-under-uncertainty problem.
And that's what trading really tests.
So the next time you review a chart and everything suddenly looks obvious, don't use it to inflate your confidence.
Use it to improve your process.
Instead of saying:
"I should have bought here."
Ask:
"What information was actually available at this moment?"
Then ask:
"Would my rules have told me to act on it?"
That turns hindsight into something useful.
Because the goal isn't to become brilliant at explaining yesterday's market.
The goal is to become calmer and more disciplined when tomorrow's chart is still being written.
Anyone can look like a genius when the answer is printed on the screen.
The real skill is making a good decision before you know how the story ends.
And the market has a very effective way of reminding you of that every morning.