Bitcoin Rally Warning
....................................................................................................................


Good morning!
The stock market is hitting the brakes this Wednesday morning, trying to shake off a rough few days as traders deal with rising bond yields, stubborn oil prices, and late-night trade headlines.
Futures are mostly idling right now: the Dow and S&P 500 are hovering right around the flatline, while tech-heavy Nasdaq contracts are nudging slightly higher. This quiet open follows a wave of selling on Tuesday and a sea of red in Asia overnight, where Japan’s Nikkei sank 3% and South Korea’s Kospi dropped 5%.
The biggest late-breaking news came from President Trump, who announced on Truth Social that he is hitting the pause button on threatened 50% tariffs on Canadian goods for three days. Following down-to-the-wire talks with Canadian Prime Minister Mark Carney's team, Trump noted both sides have a deal in place, pending final paperwork. While it avoids an immediate trade clash, it serves as a loud reminder that bigger trade talks across North America are right around the corner.
Meanwhile, Wall Street has plenty to keep it busy today. On the economic front, the Federal Reserve is set to release the meeting minutes from its July policy gathering, giving investors a closer look at how central bankers are debating inflation and future interest rate moves.
On the corporate side, retail is in the spotlight. Fresh quarterly scorecards from big-name stores like Target, Lowe’s, and TJX Companies will show whether everyday shoppers are still opening their wallets or starting to pull back.

₿ Bitcoin Rally to $64.5K Flagged as 'Liquidity Trap'
Bitcoin derivatives markets triggered a short squeeze that lifted prices 3% on Monday, but analysts caution the move was a low-volume liquidity trap rather than organic spot-driven demand.
📉 Asian Bourses Slide as Kospi Drops 5.2% on Tech Rout
Asian shares retreated Wednesday as Wall Street's pullback continued, led by South Korea's Kospi plunging 5.2%. Regional chip leaders took heavy hits, with Samsung Electronics falling 6.9% and SK Hynix dropping 7.9%.
🤖 Unitree Soars 460% in Blockbuster Shanghai STAR Debut
Chinese humanoid robotics pioneer Unitree surged 460% on its first day of trading on Shanghai’s STAR market after raising 6.1 billion yuan ($904 million), driven by strong enthusiasm for domestic robotics tech.
⚡Cerebras Unveils CS-4 System to Challenge Nvidia Accelerators
AI chipmaker Cerebras launched its new rack-scale CS-4 platform, claiming it delivers 30 times more throughput per user than standard GPUs, powered by three 4-trillion-transistor WSE-3 Turbo processors.
🇰🇷 SK Hynix Jumps 6% on Massive $28.6B Buyback Plan
Shares of SK Hynix rose 6% in premarket trade following its announcement to buy back and cancel 40 trillion won ($28.61 billion) in treasury shares and commit over 50% of free cash flow to shareholder returns through 2027.
🛢️ Oil Rises for Fourth Day Amid Hormuz Export Uncertainty
Crude benchmarks gained for a fourth straight session, with Brent climbing to $91.28 and WTI to $85.31. Mixed signals between Washington and Tehran over the status of the Strait of Hormuz keep supply risk premiums elevated.
⚽ Private Equity Targets Football Clubs Despite Mounting Operational Losses
Global institutional investors and high-net-worth consortiums continue to pour capital into Premier League franchises, banking on long-term franchise value appreciation and commercial monetization to offset rising club operating deficits.

You’re Not Protecting Profit If You Keep Cutting Winners Short
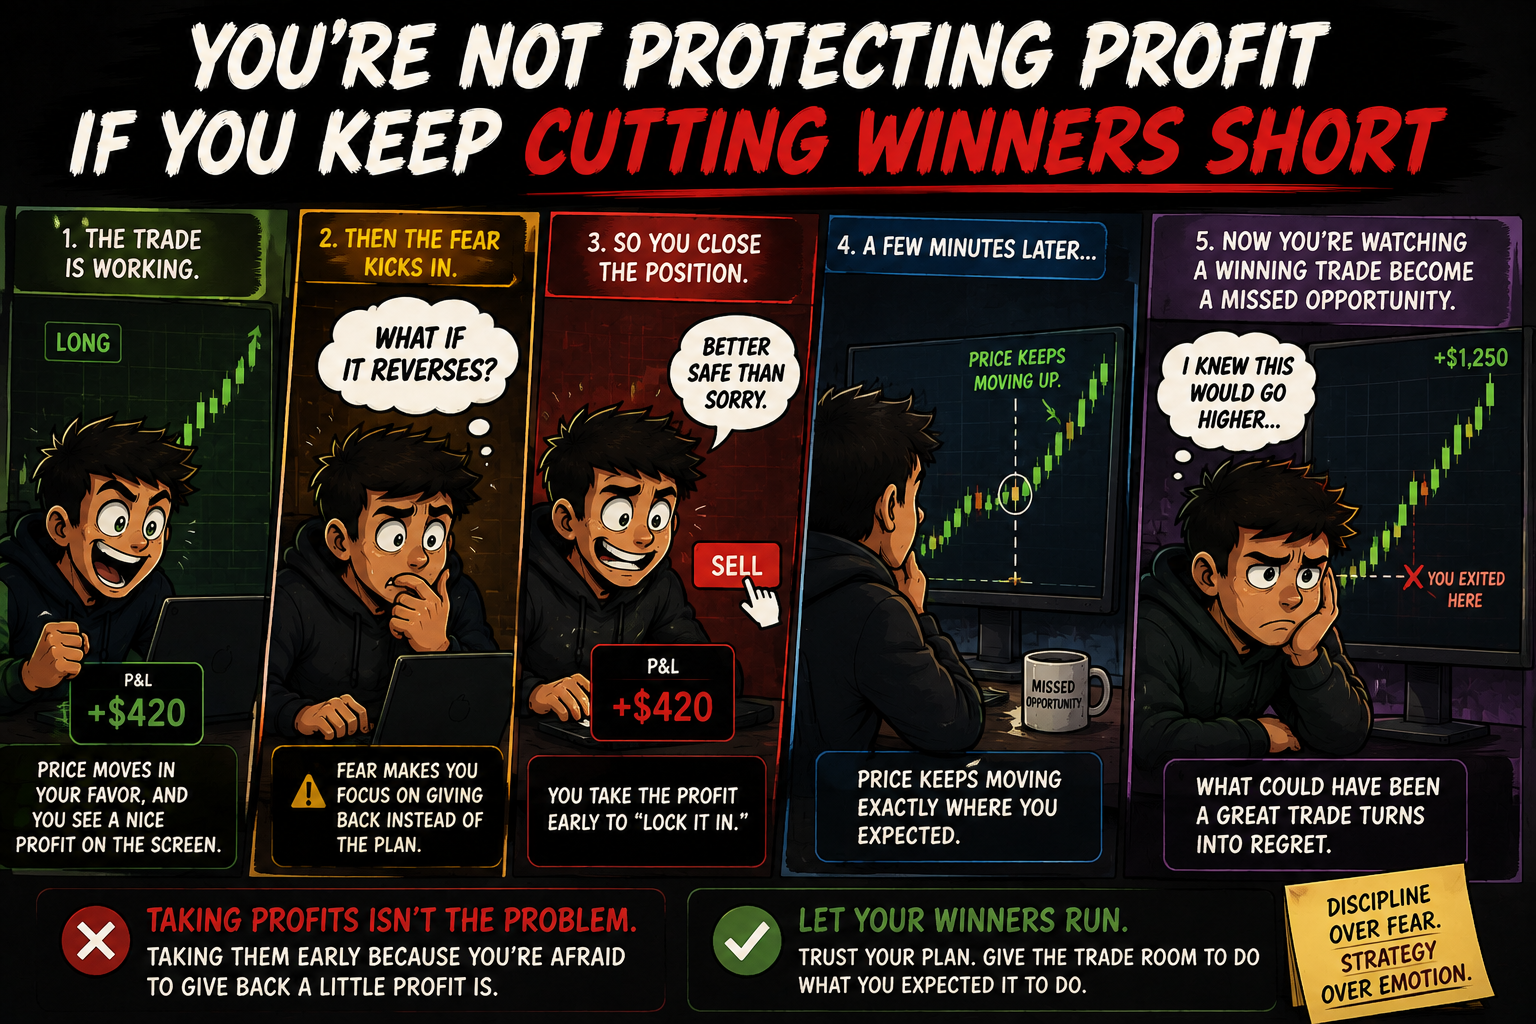
The trade is working.
Price moves in your favor, and you see a nice profit on the screen.
Then the fear kicks in.
"What if it reverses?"
So you close the position.
A few minutes later, price keeps moving exactly where you expected.
Now you're watching a winning trade become a missed opportunity.
Taking profits isn't the problem. Taking them early because you're afraid to give back a little profit is.
Many traders are more comfortable locking in a small win than allowing a good trade to reach its planned target. Over time, those small wins can limit the upside of their strategy while their losing trades are still allowed to run.
Strong traders decide their exit before they enter. They know when to take profits and what would invalidate the trade. If the original setup is still intact, they don't close simply because the profit looks tempting.
Because a green number on the screen isn't the same thing as a completed trade.
Let your plan decide when to exit—not fear.
You don't need to squeeze every dollar from a trade.
But you shouldn't cut your winners short just because you're scared of losing them.
Trading psychology often shows up in the smallest decisions—when to enter, when to hold, and when to walk away.
If you'd like to explore more thoughtful market perspectives, you can discover a few market newsletters here:

Donchian Channels
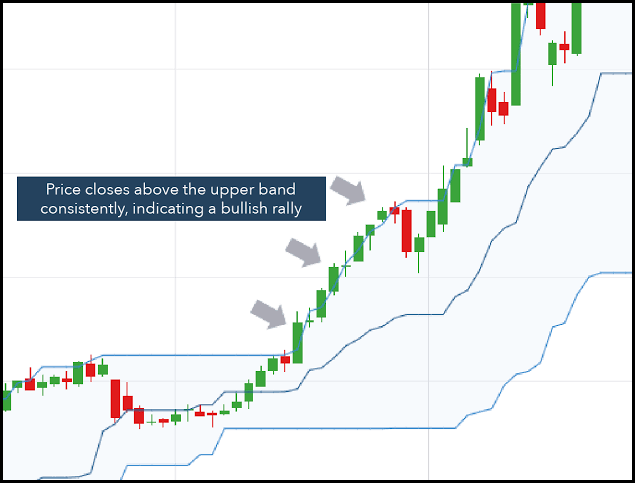
Donchian Channel Upper Band Breakout. Source: IG
Developed by Richard Donchian—the father of trend following—Donchian Channels form a dynamic envelope around price action. Plotted directly on the price chart, the indicator uses three lines based on a set lookback window (typically 20 periods): the Upper Band (highest high), the Lower Band (lowest low), and the Middle Band (the average of the upper and lower bands). It measures volatility and acts as the foundation for legendary breakout systems like the Turtle Trading strategy.
🔴 The Red Zone (Sinking to the Lower Band)
The Meaning: The price hits or breaks below the Lower Band. This proves that the asset has printed a brand-new 20-period low.
The Move: Protect capital or look for short opportunities. In a trend-following system, a break of the lower band is your strict exit signal for longs or your green light to initiate a short trend trade as downward momentum takes over.
🟡 The Yellow Zone (Inside the Channel & The Middle Band)
The Meaning: The price is fluctuating between the outer bands, crossing back and forth over the Middle Line (Median).
The Move: Hold and wait. The market is consolidating within its recent range. A narrowing channel signals low volatility (a squeeze), warning that a major directional expansion is coiling up. Use the middle line as a dynamic trailing stop or baseline.
🟢 The Green Zone (Punching the Upper Band)
The Meaning: The price surges to touch or close above the Upper Band. This confirms that the market has printed a fresh 20-period high.
The Move: Go! In classic Donchian breakout rules, touching or closing above the top band is the official green light to buy. It signals that buyers have overpowered historical supply and an aggressive upward trend is underway.
🔍 Two Simple Signals to Watch
1. The Channel Expansion (Volatility Breakout)
Watch the vertical width between the upper and lower bands before a breakout.
- The Logic: When the channel flatlines and narrows into a tight horizontal corridor, volatility is compressed. When the price suddenly punches the upper or lower band and forces the channel to widen aggressively, it confirms a genuine breakout backed by fresh institutional momentum.
2. The Midline Trailing Exit
Rather than waiting for the opposite outer band to be hit, trend traders use the middle band to lock in gains.
- The Logic: During a strong bull run, the price should stay in the upper half of the channel (between the middle and upper bands). If the price crosses back below the Middle Band, it signals that the immediate trend velocity has broken, offering a reliable point to exit and secure profits.
💡 The Simple Secret
Think of Donchian Channels as moving goalposts based on pure market extremes. Unlike Bollinger Bands, which use complex statistical standard deviations, Donchian Channels are purely mechanical: they simply map the exact highest peak and lowest floor of the last 20 days. If the price breaks outside the box, it is doing something it hasn't done in nearly a month, giving you an objective, emotion-free signal that the trend has changed.

Your Strategy Didn't Suddenly Become Stupid
For three months, everything works.
The setups are clean.
Your entries make sense.
Your targets get hit.
You're starting to feel like you've finally cracked the code.
Then the market changes.
Not dramatically.
Just enough.
The moves become choppier.
Breakouts fail more often.
Pullbacks go deeper.
The setups that used to work beautifully start producing scratch trades and small losses.
And this is where traders often make the same mistake.
They assume:
"My strategy stopped working."

So they throw it away.
New indicator.
New timeframe.
New strategy.
New YouTube guru.
New notebook titled "Trading Plan 2.0."
Three weeks later, they're lost.
The problem wasn't necessarily the strategy.
It was the lack of a process for adapting it.
Markets have different personalities.
Sometimes price trends cleanly.
Sometimes it chops sideways.
Sometimes volatility explodes.
Sometimes everything moves slowly and patiently.
A strategy built for one environment can struggle badly in another.
That's not failure.
That's normal.
The dangerous part is having no idea what to do when the environment changes.
I knew of a trader who had a profitable breakout strategy.
Then volatility dried up.
His usual breakouts kept pushing a little above resistance before falling straight back into the range.
He kept taking them.
Same rules.
Same size.
Same expectations.
After enough losses, he decided the strategy was broken.
But when he finally reviewed the data, something obvious appeared:
The strategy wasn't failing everywhere. It was failing in one specific market condition.
That distinction changed everything.
Instead of abandoning the system, he started tracking the conditions where it performed best.
Trending market?
Normal size.
Choppy market?
Reduced size or no trade.
Unusual volatility?
Different expectations.
Suddenly, "my strategy doesn't work anymore" became a much more useful question:
"What kind of market am I trading right now?"
That's the question you want in your process.
Not because you should constantly tweak your system.
Quite the opposite.
You want predefined rules for when to adapt and when to leave things alone.
For example:
What market conditions does your strategy need?
What conditions make it weaker?
What data tells you the environment has changed?
When do you reduce size?
When do you stop trading the setup temporarily?
And most importantly:
What evidence would make you return to normal?
Without answers, traders tend to swing between two extremes.
They stubbornly trade the same way through every environment...
...or they change everything after three losses.
Neither is adaptation.
That's emotional reaction.
Real adaptation is calmer.
You observe.
You measure.
You adjust.
You test.
Then you decide.
Your strategy doesn't need to work in every market.
It needs to know when it has an edge, when that edge is weakening, and what you're supposed to do about it.
That's a much more durable way to trade.
Because the goal isn't to build a strategy that never struggles.
That's impossible.
The goal is to build a trader who notices when the environment has changed...
before the market has to teach them with twenty losing trades.