Big Week for Stocks
....................................................................................................................


Good morning,
Any hopes for a quiet Monday evaporated over the weekend as the "shaky pause" in the Middle East officially shattered.
We’re starting the week with a sea of red—Dow futures are down 0.7%, while the S&P and Nasdaq have slipped about 0.6%. It turns out the road to a "good deal" just ran into a U.S. Navy blockade and a seized Iranian vessel.
The "supply heart attack" is back on the menu. After the U.S. Navy reportedly disabled an Iranian ship, Tehran retaliated by firing at vessels and slamming the Strait of Hormuz shut again, claiming the U.S. broke the ceasefire first. The reaction in the oil pits was instant: crude prices soared over 6% this morning. While Brent is still under the $100 mark (trading around $96), the sudden spike has brought those "sticky inflation" fears right back to the front of the line.
The "Magnificent Seven" are about to face the music. While we watch the headlines for the next missile or mandate, the focus is shifting to a monster week of earnings. Tesla, Intel, and United Airlines are all on deck to report. These numbers will be the ultimate test: can Corporate America’s growth story survive a world where energy prices are vertical and the world's most important waterway is a ghost town?
It’s a "safety-first" Monday. We’ve given back some of those record highs, and with the "war fog" thicker than ever, the market is bracing for a high-stakes week of earnings and escalations.

📊 Wall St. Eyes Earnings Blitz After Record-Breaking Rebound
U.S. stocks enters a critical earnings week with nearly 20% of the S&P 500 slated to report, providing a fresh test for a market that just notched all-time highs. Despite lingering geopolitical noise, the benchmark index and Nasdaq have shaken off war-related jitters to reclaim record territory, supported by expectations of robust corporate profitability.
🛢️ Oil Jumps as U.S. Navy Seizes Iranian Vessel in Gulf
Energy prices surged Monday after the U.S. Navy fired on and seized an Iranian container ship in the Gulf of Oman, retaliating for an earlier Iranian attack on a tanker. The escalation has reignited fears of a total blockade in the Strait of Hormuz, casting a shadow over the second round of planned peace negotiations.
🌏 Asia Markets Defy Tensions to Open Higher
Asia-Pacific markets largely shrugged off the weekend’s naval skirmishes, opening in the green on Monday. While investors remain cautious regarding the ship seizure and its impact on supply routes, broad regional sentiment continues to be underpinned by the recent record-setting performance on Wall Street.
🚢 Mitsubishi Heavy Surges on Historic Warship Deal
Shares of Mitsubishi Heavy Industries (MHI) climbed nearly 4% after Japan finalized an agreement to build three frigates for the Australian Navy. The deal marks Japan’s first-ever export of warships, propelling MHI shares to a 75% gain over the past year as regional defense spending accelerates.
₿ Bitcoin Slips Below $74K as Ceasefire Frays
Bitcoin erased its weekend gains, crashing briefly below $74,000 following news of the U.S. military seizure. The digital asset is under pressure as traders weigh the risk of Iranian retaliation, which could shatter the fragile ceasefire and spark a fresh wave of risk-off selling across the crypto sector.
⬇️ Gold Dips to $4,792 as Firm Dollar Revives Inflation Fears
Spot gold fell 0.7% on Monday, hitting its lowest level in a week as a strengthening U.S. dollar dampened the metal's appeal. The closure of the Strait of Hormuz has sent oil prices higher, reviving global inflation concerns and complicating the outlook for non-yielding bullion.
3️⃣ Wall Street Analysts Flag 3 Long-Term Buys Amid Chaos
Top analysts are urging investors to look past the Middle East "wild ride" to focus on high-conviction long-term plays. Despite short-term disruptions, experts suggest that current market volatility is creating compelling entry points for disciplined investors targeting high-quality equities.

If You Don’t Understand It, You Can’t Trust It
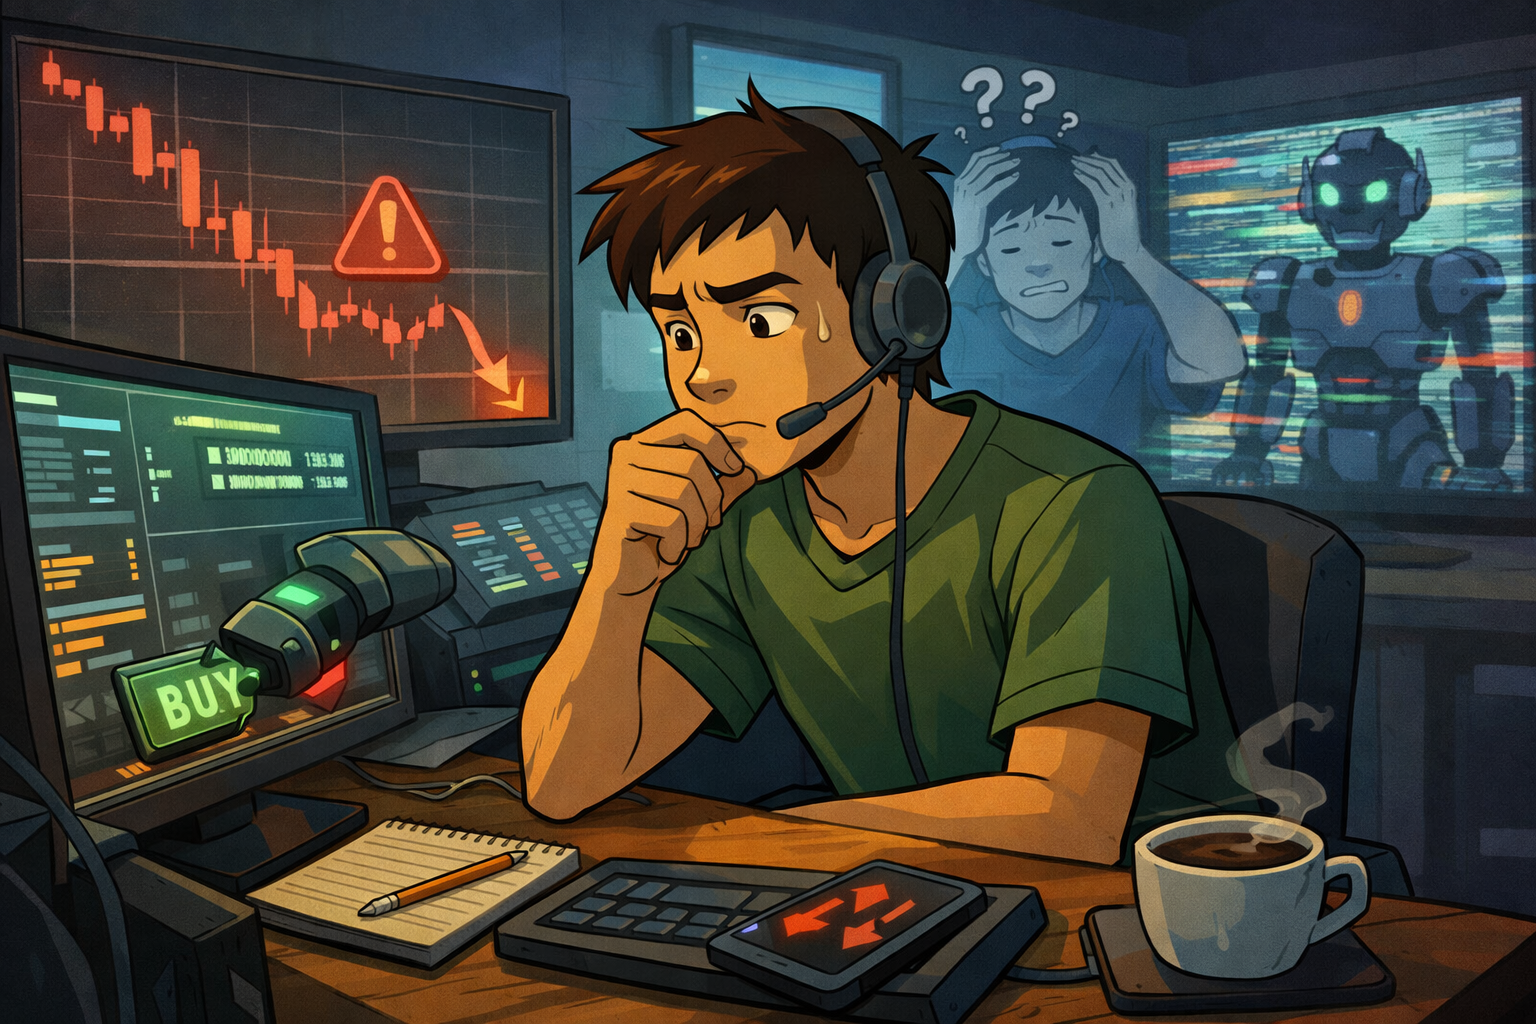
AI tools are everywhere. Signals, bots, models — all promising better entries and smarter decisions.
So you follow them.
The trade triggers. You enter. But you don’t really know why.
That’s where the risk hides.
When you rely on black-box signals, you give up understanding. If the model fails, you don’t know what changed. If conditions shift, you can’t adapt. What looked reliable suddenly breaks, and you’re left guessing.
Markets don’t stay the same. Strategies that depend on hidden logic can struggle when the environment changes.
Strong traders use tools, but they understand them. They know the conditions where a system works and where it doesn’t. They stay in control of the decision, not the tool.
When you understand your trades, your confidence is stable. You can adjust when needed. You’re not dependent on something you can’t explain.
Some traders like exploring how technology is shaping markets and how different approaches evolve.
If that’s you, you can explore a few market reads here:

Moving Average Envelope
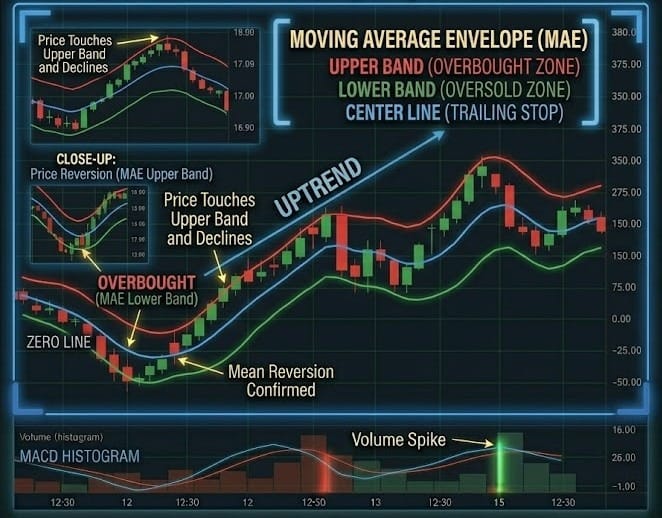
Moving Average Envelopes consist of two moving averages—one shifted upward and one shifted downward by a fixed percentage. This creates a "channel" around the price.
Unlike Bollinger Bands, which expand and contract based on volatility, Envelopes remain at a constant distance from the center, making them perfect for identifying "Overbought" and "Oversold" conditions in stable or ranging markets.
🛠️ The Strategy Logic
Use these logical triggers to identify when the "rubber band" of price has been stretched too far:
- IF: The price touches or pierces the Upper Envelope...
- THEN: The asset is "Overextended" to the upside. In a ranging market, this is a signal that the move is exhausted and a mean-reversion back to the center moving average is likely.
- THEN: The asset is "Overextended" to the upside. In a ranging market, this is a signal that the move is exhausted and a mean-reversion back to the center moving average is likely.
- IF: The price touches or pierces the Lower Envelope...
- THEN: The asset is "Oversold." This suggests a buying climax or panic-selling event has reached its limit. Look for bullish reversal candles (like a Hammer) to trade the bounce back toward the middle.
- THEN: The asset is "Oversold." This suggests a buying climax or panic-selling event has reached its limit. Look for bullish reversal candles (like a Hammer) to trade the bounce back toward the middle.
- IF: The price "hugs" the Upper Envelope while it is sloping upward...
- THEN: You are in a Strong Momentum Trend. Do not short. When price stays pinned to the upper band during a slope, it indicates that the "overbought" condition is actually a sign of extreme strength, not a reversal.
- THEN: You are in a Strong Momentum Trend. Do not short. When price stays pinned to the upper band during a slope, it indicates that the "overbought" condition is actually a sign of extreme strength, not a reversal.
- IF: The price crosses from one envelope boundary all the way to the other...
- THEN: A "Volatility Expansion" is occurring. This often signals the start of a new trend or a significant shift in the market's trading range.
- THEN: A "Volatility Expansion" is occurring. This often signals the start of a new trend or a significant shift in the market's trading range.
- IF: The price breaks and closes outside the Envelope after a long period of consolidation...
- THEN: A Breakout is confirmed. Since the envelope acts as a "fair value" container, a close outside the container suggests the market has found a new valuation and a trend is starting.
💡 Pro Tip
The "Percentage" Secret: The secret to Envelopes is the Deviation Percentage.
There is no "one-size-fits-all" setting. For a stable stock, a 2.5% or 3% envelope might work, but for a volatile crypto asset or tech stock, you might need a 10% or 20% envelope.
Always look at the historical data for your specific asset: Adjust the percentage until the Envelopes contain roughly 90% of the price action over the last 3 months. If the "peaks" of the past consistently touch the line, you’ve found the "Natural Vibration" of that asset.

Waiting for Someone to Tell You

You open the charts.
Levels are there.
Price is moving.
But you don’t act.
Not yet.
You check Telegram.
Scroll Twitter.
Wait for your mentor to drop bias.
“Let’s see what they think.”
A message comes in:
“Looking long here.”
Now you’re ready.
You open the chart again… and suddenly you “see it.”
Entry makes sense.
Direction feels clear.
Conviction is there.
So you take the trade.
But be honest…
WAS THAT YOUR IDEA — OR THEIRS?
This is where a lot of traders get stuck.
Not because they lack knowledge.
Because they’ve trained themselves to wait for confirmation from a person.
BORROWED CONVICTION FEELS STRONG… UNTIL PRESSURE HITS.
The moment price pulls back?
You hesitate.
You doubt.
You don’t know what to do.
Because you didn’t build the idea.
You adopted it.
So now you’re stuck managing a trade you don’t fully understand.
Do you hold?
Do you cut?
Do you add?
No clarity.
Just hope that the person you followed updates again.
That’s not trading.
THAT’S DEPENDENCE.
And it quietly kills your growth.
Because every time you wait for someone else’s bias:
You delay your own thinking.
You weaken your decision-making.
You avoid responsibility.
It feels safe.
But it keeps you stuck.
Good traders can learn from others.
They study.
They observe.
They take ideas.
But when it’s time to trade?
THEY DECIDE FIRST.
Not after someone posts.
Not after someone confirms.
Because in the market, responsibility is always yours.
Win or lose.
So here’s the shift:
Before you check anyone else’s opinion, ask:
“What do I see?”
Mark your levels.
Form your bias.
Define your plan.
Then — if you want — compare.
Not to copy.
To refine.
Because the goal isn’t to trade with someone else’s confidence.
It’s to build your own.