Asian Stocks Lead Gains
....................................................................................................................


Good morning,
Today is Independence Day in the U.S., meaning the trading floors in New York are locked tight. But even without Wall Street open to set the tone, global markets are putting on a fascinating show—headlined by an absolute explosion in South Korea despite a brutal slump for microchips.
South Korea goes on a wild run. The biggest surprise of the day came out of Asia, where South Korea’s Kospi index skyrocketed 4.65%, completely shrugging off the massive tech sell-off that has been plaguing the sector. The optimism spread across the region: Japan’s Nikkei jumped 1.36%, and Hong Kong’s Hang Seng climbed 1.57% to close out a highly green session in Asia.
The U.S. left behind a massive split before the holiday. This global push follows a highly confusing final session on Wall Street yesterday. Thursday’s early jobs report came in softer than expected, which is exactly what investors wanted because it revives hopes that the Federal Reserve might actually cut interest rates. This sent the Dow Jones roaring up 594 points to a brand-new all-time record close of 52,900.
But chip stocks are getting absolutely hammered. While the Dow celebrated, tech investors were left nursing major wounds. Microchip stocks suffered their second straight day of heavy selling, dragging the Nasdaq down 0.8%. Heavy hitters took massive hits: Teradyne plunged over 13%, KLA dropped 11.5%, and Micron shed 5.5%, proving that investors are aggressively rotating out of the high-flying AI chip trade and moving into safer, defensive sectors like utilities.
Europe is holding steady at the highs. Over in Europe, markets are trading mixed but stable, with the pan-European Stoxx 600 hovering near the flatline. Even with the minor pause today, Europe is locking in its fourth straight winning week with a solid 2% gain.
It’s a quiet holiday Friday in America, but the global message is loud and clear: investors love the idea of lower interest rates, but the pure, unchecked AI chip rally is officially taking a back seat.

🇺🇸 U.S. Financial Markets Closed for Independence Day Holiday Weekend
The New York Stock Exchange, Nasdaq, and the U.S. bond market remained closed on Friday, July 3, in observance of Independence Day. Regular trading operations on the major U.S. financial exchanges are scheduled to resume at their standard opening hours on Monday, July 6.
📊 Wall Street and Global Stocks Rise as Soft Jobs Data Calms Rate Fears
Global equities moved broadly higher as a cooling U.S. labor market calmed intense monetary tightening anxieties. The closely watched nonfarm payrolls report revealed the U.S. economy added just 57,000 jobs last month, a tepid macro reading that successfully eased immediate investor fears over a potential September Federal Reserve interest rate increase.
🌏 International Bourses Rally as South Korea Jumps 4.6% to Defy Chip Slump
Global stock markets comfortably ignored recent technology sector weakness to notch broad gains while American cash floors were dark. In Asia, Japan's Nikkei 225 jumped 1.36%, Hong Kong's Hang Seng index climbed 1.57%, and South Korea's KOSPI index led the global advance with a massive 4.65% explosion, shaking off a localized rotation out of hardware makers.
💵 Dollar Slumps to 12-Week Low as Labor Statistics Cool Rate-Hike Bets
The U.S. dollar index headed toward its steepest weekly decline since April as global currency desks aggressively lowered their interest rate path projections. The broad greenback weakness pushed the euro to a two-week high of $1.1472, while British sterling advanced 1.2% on the week to $1.3380, providing immediate relief to the embattled Japanese yen.
🥇Gold Secures First Weekly Gain in a Month on Lowered Central Bank Risks
Spot gold prices firmed on Friday, positioning the precious metal to book its first positive weekly close since late May. While persistent dollar strength and hawkish central bank shifts have heavily suppressed bullion throughout the year, investors aggressively scaled back their interest rate-hike expectations following the soft employment data.
📈 Kuaishou Swings Negative Despite Tencent Backing $2.8B Kling AI Funding
Shares of Kuaishou jumped over 6% at the opening bell before shedding all intraday gains to finish 0.09% lower on Friday. The late-day retreat occurred despite its creator-focused video subsidiary, Kling AI, successfully closing a massive 19 billion yuan ($2.79 billion) funding round—which included a $200 million anchor commitment from Tencent—targeting a standalone $15 billion valuation.
₿ Bitcoin ETFs Exceed $200M in Daily Inflows as Token Recovers Above $61K
U.S. spot Bitcoin exchange-traded funds registered a powerful $221.7 million intake, marking their single strongest day of net capital inflows since early May. The heavy institutional accumulation provided a solid liquidity backstop for decentralized digital assets, helping push Bitcoin's spot price back above the key $61,000 threshold.

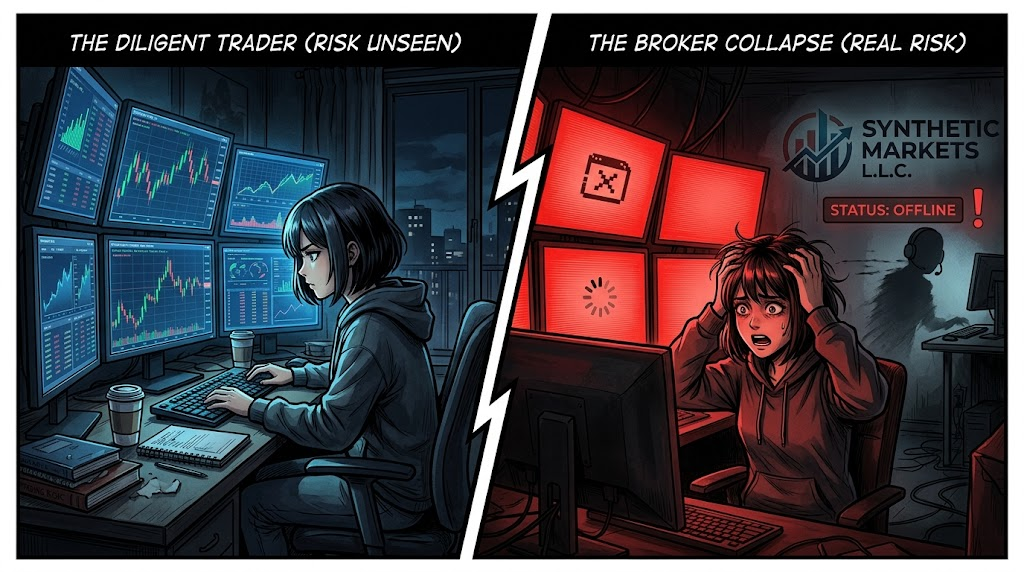
Your Broker Is a Risk Too.
Most traders spend hours choosing a strategy.
Very few spend the same amount of time choosing a broker.
Until something goes wrong.
A withdrawal gets delayed. The platform goes offline. Customer support disappears when you need it most. Suddenly, the biggest risk isn't the market—it's the company holding your money.
That's easy to overlook.
Many traders compare spreads and commissions but ignore the broker's reputation, financial stability, and reliability. Those things don't matter... until they matter a lot.
Strong traders do their homework before opening an account. They understand who they're trading with, how client funds are handled, and what protections are in place if something goes wrong.
Because trusting your broker is just as important as trusting your strategy.
The goal isn't to find the cheapest broker.
It's to find one you can rely on when the market gets difficult.
Your trading account deserves the same level of due diligence as your trades.
Markets involve more than charts and setups. Understanding the businesses and systems behind your trades can make you a more informed trader.
Explore a few market newsletters here:

Volume Weighted Average Price (VWAP)
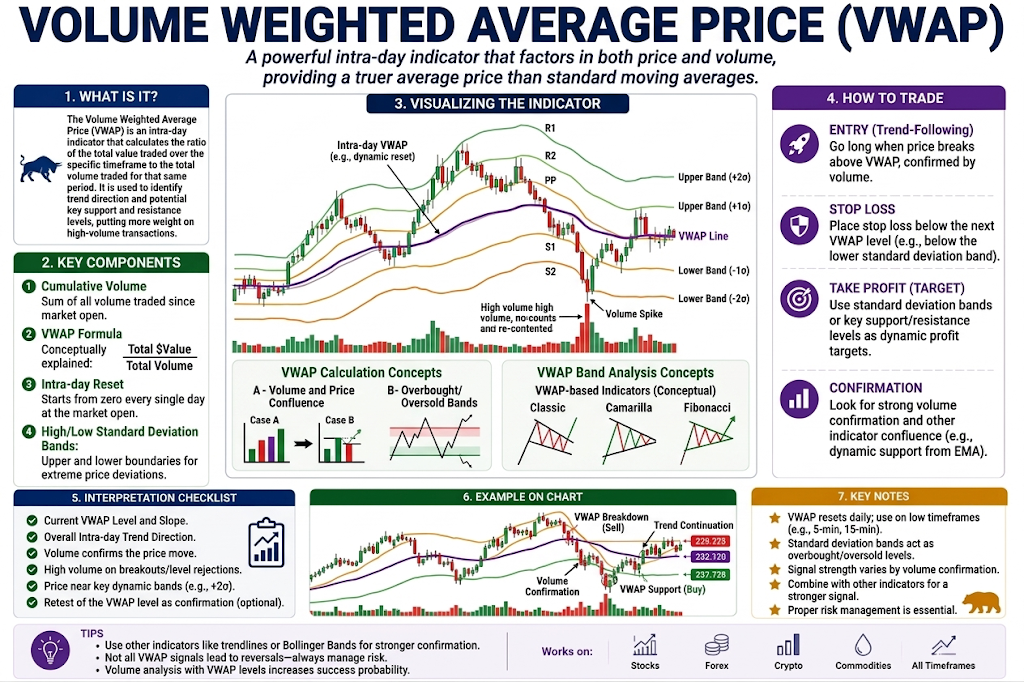
VWAP is the ultimate benchmark line used by institutional traders and algorithms. Unlike a standard moving average that only looks at price, VWAP factors in the amount of trading volume happening at each price level throughout the day. It calculates the true, volume-backed "fair value" of an asset. It resets to zero at the opening bell of every single trading day.
🔴 The Red Zone (Price Above VWAP)
The Meaning: The current price is trading completely above the VWAP line. This proves that the average buyer today is currently sitting in a profit, and the immediate market sentiment is highly aggressive and bullish.
The Move: Look for long entries or hold. However, avoid chasing if the price stretches too far above the line, as institutions view the asset as "overpriced" relative to the day's average and will stop buying until it cools down.
🟡 The Yellow Zone (The VWAP Line Touch)
The Meaning: The price pulls back and lands directly on top of the VWAP line.
The Move: Watch closely. This is the ultimate battleground floor. Because big funds aim to buy at or below average efficiency, they will frequently step in to aggressively defend this line. A clean bounce off VWAP is a high-conviction trigger that the daily trend is resuming.
🟢 The Green Zone (Price Below VWAP)
The Meaning: The current price is trading completely below the VWAP line. This means the average trader who bought today is currently losing money, and the bears have established short-term control.
The Move: Exercise caution or look to short. Institutions look at prices below VWAP as "cheap" or "good value" to accumulate long-term shares, but for day traders, trading below this ceiling means you are fighting a heavy downward current.
🔍 Two Simple Signals to Watch
1. The Institutional Fade
Watch how the price behaves the very first time it aggressively pulls back to the VWAP line after a big morning run.
- The Logic: If huge buy orders suddenly stack up right at the line and the price refuses to break below it, it confirms that institutions are using VWAP as their structural "buy floor." This is one of the safest day-trading entries available.
2. The Failed Mid-Day Cross
Sometimes a weak stock will attempt to rally, pop up to touch the VWAP line from underneath, but fail to close above it.
- The Logic: Because VWAP acts as a heavy ceiling when the price is underneath it, a failure to break through mid-day proves that sellers are completely trapping the market. This is a classic signal that the downtrend is locked in for the rest of the session.
💡 The Simple Secret
Think of VWAP as the "Institutional Line in the Sand." Large mutual funds and algorithms do not care about standard chart lines; their performance is judged strictly on whether they bought better or worse than the daily VWAP average. Because the entire smart-money world uses this exact line to execute their massive trades, the price treats it like a literal magnet and brick wall all day long.

You Think You Have Five Trades. You Really Have One.

You glance at your portfolio and feel pretty good.
Five positions open.
Different charts.
Different ticker symbols.
Looks diversified.
Until the market has one bad day.
Suddenly...
Everything is red.
Every. Single. Position.
That's when it hits you.
You didn't have five different ideas.
You had one idea wearing five different outfits.
This happens more often than traders realize.
You buy three AI stocks because they all "look strong."
You add two semiconductor names because the charts are clean.
Maybe you even throw in a tech ETF for "diversification."
On paper, that's five trades.
In reality?
It's one giant bet that technology keeps going up.
The same thing happens in Forex.
Long EUR/USD.
Long GBP/USD.
Long AUD/USD.
They look like different trades...
...until the U.S. dollar suddenly strengthens and all three positions move against you at the same time.
The danger isn't just financial.
It's psychological.
When several correlated trades start losing together, your brain feels like everything is going wrong at once.
You panic faster.
You lose confidence faster.
And you start making emotional decisions because the damage looks much bigger than you expected.
The irony is that most traders never intended to take oversized risk.
They just never stopped to ask:
"What is the ONE thing all of these trades have in common?"
That's the question professionals ask before adding another position.
Not:
"Do I like this chart?"
But:
"What risk am I adding that I already own?"
Because risk has a sneaky way of disguising itself.
Different company.
Same sector.
Different currency pair.
Same underlying driver.
Different ticker.
Same story.
One of the simplest habits you can build is this:
Before entering a new trade, don't just look at the setup.
Look at your existing positions.
Ask yourself:
"If one major headline hit this market today, how many of my trades would suffer together?"
If the answer is "most of them," you're probably carrying far more risk than your position sizes suggest.
Remember, diversification isn't about owning more charts.
It's about owning different risks.
Because when the market catches a cold...
You don't want your entire portfolio sneezing at the same time.