Trump Coin Crashes 96%
....................................................................................................................


Good morning,
We’re starting the week in a tense stalemate. After finishing last week at record highs, the Nasdaq and S&P 500 are trading flat, while the Dow has dipped 0.2%. Everyone is trying to figure out if the latest headline out of Iran is a genuine olive branch or just another high-stakes stall tactic.
Iran just put a "reopening" plan on the table. According to reports from Axios, Tehran is proposing to lift the blockade on the Strait of Hormuz and end the war, but they want to kick the nuclear negotiations down the road. It’s a "deal now, talk later" approach that has oil traders very skeptical. Brent crude just retook $100 a barrel, while WTI is hovering over $96, proving that until the tankers actually start moving, the "supply heart attack" remains the base case for the economy.
The "Magnificent Seven" are about to be cross-examined. This is the most pivotal week of the quarter, with five of the world’s biggest tech giants set to report. Their numbers will be the ultimate stress test for this "war-resilient" rally. If these AI darlings can’t beat the heat of $100 oil and rising logistical costs, those record highs could vanish fast.
The Fed’s "changing of the guard" begins now. As if the Middle East weren't enough, we’ve got a Federal Reserve policy meeting this week. This is one of the final sessions chaired by Jerome Powell before he hands the keys to Kevin Warsh. Investors are desperately looking for a hint that the Fed is ready to pivot, but with energy prices flaring up again, the "higher for longer" shadow is still looming large.
We’re sitting at the top of the mountain, but with a potential peace deal, a Fed meeting, and Big Tech earnings all hitting at once, the view could change in an instant.

📊 Futures Falter Ahead of Pivotal Big Tech Earnings Week
U.S. stock futures stalled Monday morning as investors braced for a high-stakes week of earnings from Silicon Valley’s largest players. Contracts on the S&P 500 and Nasdaq were broadly flat following last week’s record-setting run, while Dow futures dipped 0.2% as the market assesses a fresh proposal from Tehran to reopen the Strait of Hormuz.
🛢️ Oil Rises to $108 as Stalled Peace Talks Keep Hormuz Shut
Brent crude jumped 3% to $108.50 a barrel after President Trump canceled a key diplomatic mission to Pakistan, prolonging the supply disruption in the Persian Gulf. Prices pared some gains following reports from Axios that Iran has offered a new proposal to reopen the waterway, though Tehran continues to refuse negotiations under threat.
🥇 Gold Steadies as War-Driven Inflation Risks Persist
Bullion prices held steady as the Middle East conflict entered its third month with no definitive resolution in sight. The persistent chokehold on global energy flows via the Strait of Hormuz continues to underpin gold's appeal as a hedge against protracted war-driven inflation.
🇯🇵 Nikkei and Kospi Hit Record Highs Despite Diplomatic Setbacks
Japan’s Nikkei 225 surged 1.38% to close above 60,500 for the first time, while South Korea’s Kospi jumped over 2% to a new peak. Asian investors largely shrugged off stalled U.S.-Iran negotiations, focusing instead on the potential for the new Iranian proposal to finally end the regional oil shock.
🇨🇳 China Industrial Profits Jump 15% Amid AI and Chip Boom
Profits at Chinese industrial firms grew at their fastest pace in six months, rising 15.8% in March. The surge highlights the resilience of China’s semiconductor and AI infrastructure sectors, which have managed to offset soaring raw material costs triggered by the Middle East conflict.
📉 TRUMP Meme Coin Crashes 96% Amid Mar-a-Lago Gala
The "Official Trump" (TRUMP) token has plummeted to an all-time low, losing 96% of its peak value even as the President prepares to host a VIP crypto gala in Florida. The exclusive event targets the token's largest holders, including those who qualified by purchasing branded sneakers and watches.
📈 Strategists Maintain Bullish Stance on AI Infrastructure Trade
Wall Street analysts are doubling down on the "AI trade," arguing that structural demand for chips and cloud computing remains the most powerful catalyst for equities. Despite the geopolitical noise, experts believe the current earnings season will validate the massive capital expenditures pouring into the sector.

Building a Bot Isn’t Just About Code Anymore
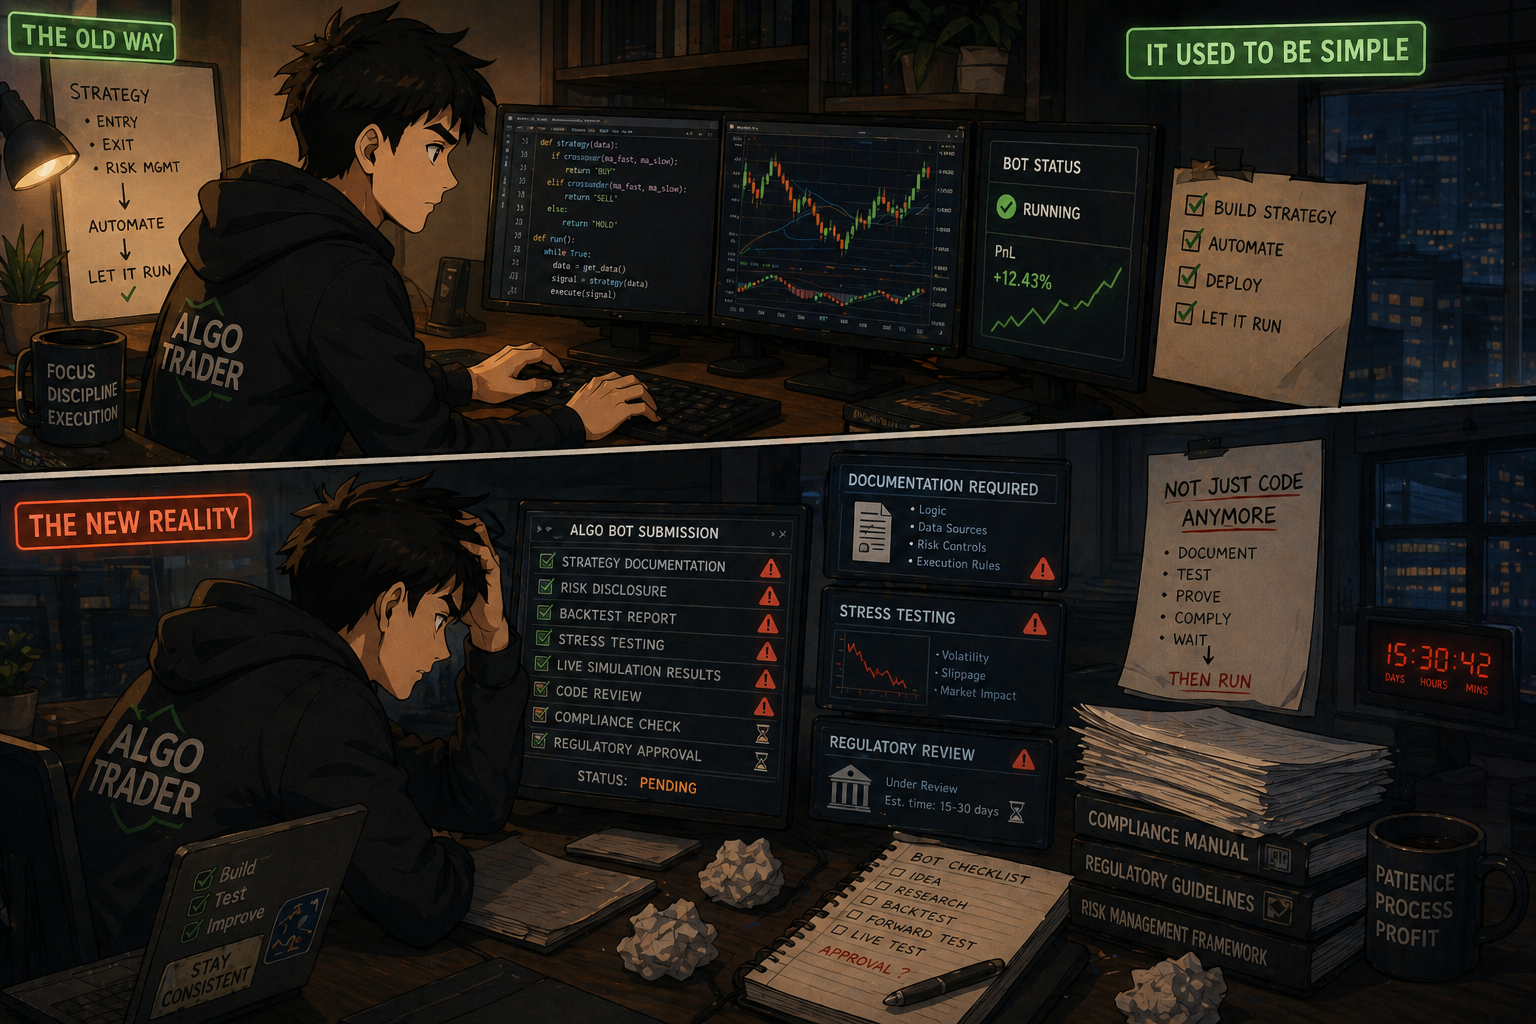
It used to be simple. Build a strategy. Automate it. Let it run.
Now there’s another layer.
Rules. Approvals. Testing requirements. In many places, automated strategies need to be documented, stress-tested, and sometimes registered before they’re allowed to run.
That’s where things slow down.
It’s not just about whether the strategy works. It’s about whether it meets standards. Whether it can handle extreme conditions. Whether it’s compliant.
For many traders, this adds friction. More time. More cost. More complexity.
Strong traders understand this shift. They don’t rush automation. They build simple systems first. They test thoroughly. They focus on strategies that are clear, explainable, and adaptable.
Because complexity without control creates risk.
When you approach automation with structure, you avoid surprises. You build systems that can last, not just run.
Some traders like understanding how trading is evolving beyond charts, including technology and regulation.
If that’s you, you can explore a few market reads here:

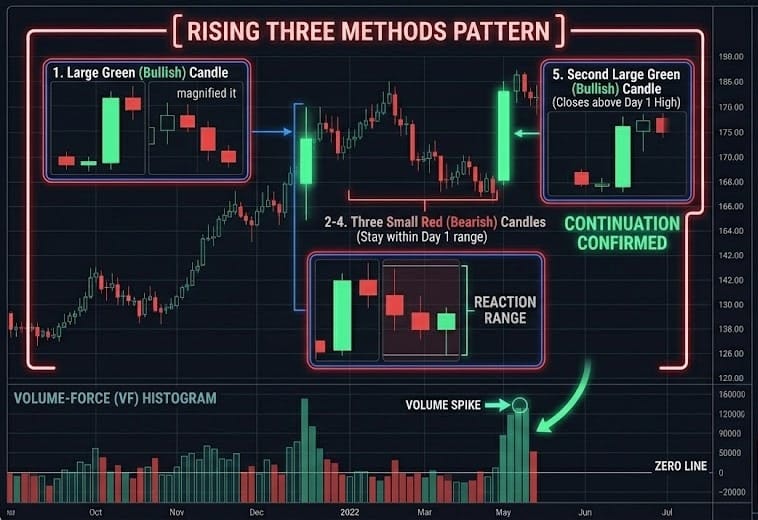
Rising Three Methods
Developed by Doug Schaff, the STC is often called the "better MACD." It combines the benefits of MACD (trend following) with the benefits of Stochastics (speed and cycle detection).
It was designed to filter out the noise of price action by using a double-smoothed process, allowing it to identify trends much faster and more accurately than traditional oscillators.
🛠️ The Strategy Logic
Use these logical triggers to identify the exact start and end of a market cycle with minimal "lag":
- IF: The STC line crosses above the 25 level (from the bottom oversold zone)...
- THEN: A bullish cycle has begun. This is a high-probability "Buy" signal, indicating that the downward momentum has successfully bottomed out and the "new" trend is moving up.
- THEN: A bullish cycle has begun. This is a high-probability "Buy" signal, indicating that the downward momentum has successfully bottomed out and the "new" trend is moving up.
- IF: The STC line crosses below the 75 level (from the top overbought zone)...
- THEN: A bearish cycle is starting. The buying momentum has reached its peak and is now rolling over, signaling a "Sell" or an exit for long positions.
- THEN: A bearish cycle is starting. The buying momentum has reached its peak and is now rolling over, signaling a "Sell" or an exit for long positions.
- IF: The STC line stays flat at 100 for several candles while price is rising...
- THEN: The trend is in a Super-Bullish state. Do not sell yet! A flat line at 100 means the momentum is maxed out in the bulls' favor. Only exit when the line finally "breaks" and starts to drop below 75.
- THEN: The trend is in a Super-Bullish state. Do not sell yet! A flat line at 100 means the momentum is maxed out in the bulls' favor. Only exit when the line finally "breaks" and starts to drop below 75.
- IF: Price makes a new high, but the STC cycle peak is lower than the previous peak...
- THEN: You have a Bearish Divergence. Even if price is climbing, the "cyclical energy" is fading. This often precedes a sharp drop as the current market cycle exhausts itself.
- THEN: You have a Bearish Divergence. Even if price is climbing, the "cyclical energy" is fading. This often precedes a sharp drop as the current market cycle exhausts itself.
- IF: The STC line turns upward but fails to reach the 75 level before turning back down...
- THEN: The rally was a "Fake-out." This indicates a very weak bullish attempt that was immediately crushed by the dominant bearish trend.
💡 Pro Tip
The "Trend Alignment" Secret: Because the STC is very fast, it can occasionally give a "buy" signal during a major downtrend (a "relief bounce"). To avoid this, pair the STC with a 100-period Exponential Moving Average (EMA).
Only take Bullish STC crosses (above 25) when price is above the 100 EMA. Only take Bearish STC crosses (below 75) when price is below the 100 EMA.
This ensures you are trading the "cycle" in the same direction as the "Big Tide."

You Hit a New High… Then Gave It Back
You finally do it.
New equity high. 📈
Best week.
Clean execution.
Confidence up.
It feels like progress.
But the next session?
Something’s off.
You’re not as calm.
Not as clear.
Decisions feel… heavier.
Then it starts.
You take a trade you’d normally skip.
You size a bit weird.
You hesitate on a clean setup.
And slowly…
You give some of it back.
Sometimes all of it.
THIS IS THE PART NOBODY TALKS ABOUT.
Growth sounds exciting.
But when you hit a level you’ve never held before?
It feels unfamiliar.
And unfamiliar often feels… unsafe.
So your behavior shifts.
Not on purpose.
Subconsciously.
YOU START TRADING TO PROTECT — OR PROVE.
Protect the new high:
You cut winners early.
You avoid valid trades.
You play not to lose.
Or prove you deserve it:
You overtrade.
You force setups.
You size up to “confirm” your skill.
Both lead to the same place:
GIVING BACK GAINS YOU DIDN’T KNOW HOW TO HOLD.
It’s not a strategy issue.
It’s exposure to a new level of pressure.
More money = more emotion.
And if your mindset hasn’t caught up…
Your behavior pulls you back to what feels “normal.”
Professionals understand this phase.
They don’t celebrate with bigger risk.
They stabilize.
Same size.
Same rules.
Same patience.
They let the new level become familiar.
Because consistency at a new high matters more than hitting it once.
Let’s be real:
Making money is one skill.
KEEPING IT IS ANOTHER.
So here’s the shift:
When you hit a new equity high, don’t ask:
“How do I grow faster?”
Ask:
“How do I behave the same at this level?”
Because the traders who last…
Aren’t the ones who spike.
They’re the ones who can stay there.