Samsung Hits $1T Valuation
....................................................................................................................


Good morning,
We’re starting Wednesday with a serious spring in our step. After a record-breaking Tuesday for all three major indexes, the momentum is carrying over—Nasdaq futures are jumping 0.8%, while the S&P 500 is up another 0.3%. It’s becoming clear that the "war fog" we were worried about earlier this year is being burned off by a massive heatwave of corporate profits.
The "AI Hardware" trade just went into overdrive. If you thought the AI hype was cooling, AMD and Super Micro (SMCI) just proved otherwise. AMD shares exploded nearly 15% in the overnight session after crushing earnings and promising a massive Q2, while SMCI rocketed 18%. It’s a loud signal to the market: the infrastructure for the next tech era isn't just being built—it’s being built at a breakneck pace.
The scorecard is in, and it’s a blowout. With 85% of S&P 500 companies beating profit estimates so far, this is officially one of the most resilient earnings seasons in recent memory. Even with the Strait of Hormuz still a major question mark, Corporate America is finding a way to extract growth.
We’re entering a "Jobs Marathon." After a steady JOLTS report yesterday, we’re getting the ADP Private Employment numbers this morning. It’s the final warm-up before Friday’s massive jobs report. Investors are looking for that "Goldilocks" zone—an economy strong enough to support growth, but not so hot that it forces the Fed to kill the party.
The "Real World" pulse check is happening now. Before the bell, we’re getting results from the heavy hitters: Disney, Uber, and Novo Nordisk. Between the "happiest place on earth," the gig economy, and the weight-loss drug craze, we’re about to find out exactly where consumers are spending their cash while the tech giants dominate the headlines.

🧠 Samsung Crosses $1 Trillion Valuation as AI Frenzy Drives Historic Rally
Samsung shares surged over 15%, pushing its market cap past the $1 trillion mark following record Q1 earnings where operating profit jumped eightfold to 57.2 trillion won. The rally, fueled by a Bloomberg report of exploratory chip talks with Apple, helped the benchmark Kospi top 7,000 for the first time in history.
📊 Global Stocks Surge on Iran Peace Hopes and AI Euphoria
Global markets leapt to fresh records as Brent crude fell 3.2% to $106.40 following President Trump’s reports of "great progress" toward a peace deal with Tehran. The cooling geopolitical tension, combined with accelerating AI momentum, drove the MSCI All-Country World Index and S&P 500 futures to new peaks.
📈 AMD Soars 18% on Q1 Earnings Beat and Bullish Outlook
AMD shares rocketed in premarket trading after posting EPS of $1.37 on $10.25 billion in revenue, comfortably beating Wall Street estimates. The chipmaker issued a strong Q2 revenue forecast of up to $11.5 billion, signaling that demand for its AI-capable processors is vastly outstripping prior projections.
🖥️ Super Micro Rallies 18% as Strong AI Outlook Offsets Revenue Miss
Super Micro shares surged despite missing revenue targets by $2 billion, as investors focused on a 22-cent EPS beat and robust forward guidance. CEO Charles Liang attributed the revenue shortfall to "customer readiness" regarding power and networking, but maintained that AI infrastructure demand remains at record levels.
🥇 Gold Jumps 2.3% as Trump Touts Iran Progress and Dollar Falls
Bullion rose to above $4,660 an ounce as the U.S. dollar declined 0.5% on news of a potential diplomatic breakthrough with Iran. President Trump’s decision to pause naval escort efforts in the Strait of Hormuz reduced immediate inflationary pressure, making gold a preferred play as the greenback softened.
🇰🇷 AI Boom Drives Record Kospi Rally as Chip Giants Soar
South Korea’s Kospi index skyrocketed nearly 7% to a fresh record Wednesday, led by a 14% jump in Samsung Electronics and an 11% surge in SK Hynix. The massive buying spree reflects investor confidence in AI infrastructure growth and mounting hopes for a diplomatic resolution to the U.S.-Iran conflict.
📉 Oil Prices Fall as Trump Pauses Hormuz Escort Effort
International benchmark Brent crude slid nearly 2% to $107.77 after President Trump announced a temporary halt to "Project Freedom." The suspension of the U.S. military’s naval escort effort in the Strait of Hormuz is seen as a major de-escalation signal, raising hopes for a finalized peace deal with Iran.

Profits on the Screen Don’t Mean Money in Your Pocket

You hit a good run. The account is up.
It feels like progress.
Then you try to withdraw.
Suddenly there are rules.
Minimum trading days.
Profit splits.
Consistency requirements. Processing times.
What looked like profit now comes with conditions.
That’s where frustration starts.
Many traders focus only on making money in the account.
They don’t fully understand how payouts actually work. Delays happen. Requests get denied.
Expectations don’t match reality.
Strong traders learn the payout rules before they trade.
They know the conditions. They plan around them. They treat withdrawals as part of the strategy, not an afterthought.
Because profit only matters when it’s realized.
When you understand the structure, your decisions become more aligned.
You avoid surprises.
You trade with clarity instead of assumptions.
Some traders like understanding the practical side of trading beyond charts, including payouts and account rules.
If that’s you, you can explore a few market reads here:

Bullish Belt Hold
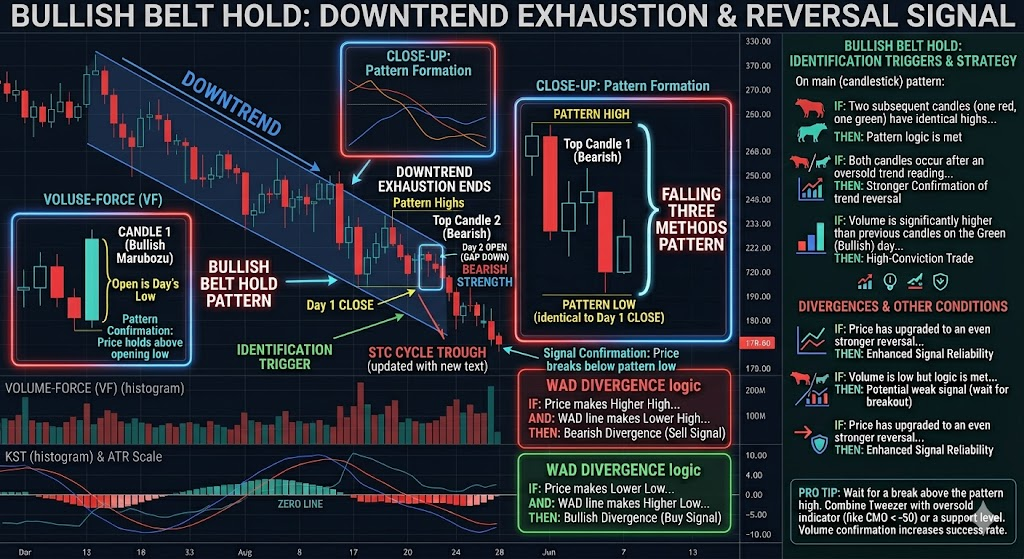
The Bullish Belt Hold is a single-candle reversal pattern that signals a sudden and decisive shift in power. It occurs after a stretch of bearish candles when the price gaps down to open at a new low, but then immediately rallies to close near its high. It is called a "Belt Hold" because it represents the bulls grabbing the bears and holding them firmly in place, preventing any further downward movement.
🛠️ The Strategy Logic
Use these logical triggers to identify when a "selling climax" has turned into a high-speed recovery:
- IF: The candle opens at its absolute low (no lower wick) and rallies to close near its high...
- THEN: You have a valid Bullish Belt Hold. The lack of a lower wick proves that from the very first second of trading, the bears were unable to push the price even one tick lower than the open.
- THEN: You have a valid Bullish Belt Hold. The lack of a lower wick proves that from the very first second of trading, the bears were unable to push the price even one tick lower than the open.
- IF: The pattern forms after a significant downtrend or at a major support level...
- THEN: The signal is high-conviction. This suggests that the "last" of the sellers were washed out at the open, and institutional buyers have stepped in to clear the remaining supply.
- THEN: The signal is high-conviction. This suggests that the "last" of the sellers were washed out at the open, and institutional buyers have stepped in to clear the remaining supply.
- IF: The body of the Belt Hold is larger than the previous three bearish candles...
- THEN: This is an "Engulfing" force. The sheer size of the candle shows that the bulls have not just arrived—they have completely overwhelmed the recent selling momentum in a single session.
- THEN: This is an "Engulfing" force. The sheer size of the candle shows that the bulls have not just arrived—they have completely overwhelmed the recent selling momentum in a single session.
- IF: The next candle closes above the high of the Belt Hold candle...
- THEN: The reversal is confirmed. This is the "Trigger" for a long entry. It proves that the buying pressure from the Belt Hold session has "follow-through" and isn't just a one-day short-covering bounce.
- THEN: The reversal is confirmed. This is the "Trigger" for a long entry. It proves that the buying pressure from the Belt Hold session has "follow-through" and isn't just a one-day short-covering bounce.
- IF: Volume is significantly higher than the average volume of the last 10 days...
- THEN: The "Smart Money" has entered. High volume on a "shaved bottom" candle is one of the most reliable signs of institutional accumulation.
💡 Pro Tip
The "Shaved Bottom" Rule: The most important part of this pattern is the Open. If there is any noticeable lower wick, the pattern is technically just a strong green candle, not a Belt Hold.
The "Belt Hold" power comes from the fact that the Open was the Low. If the price later pulls back and touches that open price, the trade is invalidated.
Always place your stop-loss 1–2 ticks below the opening price. If the bulls are truly in control, they will never allow the price to revisit that level.

You Entered on 15M… Then Let 1M Shake You Out

The setup was clean.
You saw it on the 15-minute.
Structure made sense.
Level was clear.
You entered with a plan.
Stop defined.
Target mapped.
Everything aligned.
Then you dropped to the 1-minute.
Just to “manage it better.”
That’s where it started.
A small pullback looks sharp.
A red candle feels aggressive.
Momentum suddenly looks weak.
Now your brain shifts.
“Is this failing?”
“Maybe I should cut early.”
“That doesn’t look good…”
So you exit.
Small loss. Or tiny win.
Feels controlled.
Then price does exactly what the 15-minute said it would.
Moves clean.
Hits target.
Without you.
THIS IS TIMEFRAME DRIFT.
You made the decision on one timeframe…
Then let a completely different one control your emotions.
YOU CHANGED THE RULES MID-TRADE.
The 15-minute needed space.
The 1-minute shows noise.
But you treated that noise like signal.
And it cost you the trade.
This is one of the most common leaks.
Because lower timeframes feel more “real.”
More detail.
More movement.
More urgency.
But more detail doesn’t mean better decisions.
IT JUST MEANS MORE DISTRACTION.
Professionals stay aligned.
If the trade comes from the 15-minute:
They manage it on the 15-minute.
Not every tick.Not every micro pullback.
They wait for meaningful change.
Not noise.
Let’s be honest:
Dropping timeframes mid-trade isn’t about precision.
It’s about control.
You want to feel on top of the trade.
But that control is fake.
Because all it does is pull you out of good positions early.
So here’s the shift:
If you enter on a timeframe…
Respect it all the way through.
Don’t let a smaller chart talk you out of a bigger idea.
Because the market doesn’t reward the trader who reacts fastest.
It rewards the one who stays aligned with their plan.