Bitcoin Roars Again
....................................................................................................................


Good morning,
We’re starting the week with a bit of a mixed bag.
After hitting record highs on Friday, the S&P 500 is trading flat, while the Nasdaq is inching up 0.2%. The Dow is the lone laggard, slipping 0.2% as investors try to make sense of the latest maneuver from the White House. It feels like everyone is squinting at the headlines, trying to figure out if we’re heading for a resolution or just a different kind of chaos.
Trump is launching a rescue mission for the Strait. On Sunday, the President unveiled "Project Freedom," a new initiative designed to help cargo ships and crews from neutral nations escape the blockaded Strait of Hormuz. It’s supposed to kick off today, but since there’s no official "how-to" guide yet, traders are nervous about whether this helps clear the waterway or just adds more friction. On the bright side, Iran confirmed they’ve received a U.S. response to their latest peace proposal, which suggests the "diplomatic off-ramp" is still under construction.
The "AI Engine" is about to be pressure-tested. While we watch the ships, the tech world is bracing for a massive week of semiconductor earnings. AMD and Arm Holdings are the heavyweights on deck, alongside Palantir. After the "Big Tech" win last week, these names will tell us if the hardware side of the AI boom is still accelerating or if the supply chain drama is starting to catch up.
A massive "Jobs Cliff" might be coming Friday. While we’ve been riding high on a resilient economy, economists are forecasting a sharp drop for the April jobs report. After March’s 178,000 surge, expectations are sitting at just 60,000 new positions. If the numbers come in that low, the "recession" conversation might start drowning out the "peace" talk.
It’s a "watch and wait" Monday.

🪙Bitcoin Breaks $80K as Institutional Demand Surges
Bitcoin topped $80,000 for the first time in 3 months, fueled by $630M ETF inflows and a steady recovery from February’s $60K lows.
📈 SK Hynix Jumps 13% as AI Chip Boom Accelerates
SK Hynix surged 12.5% to record highs, outperforming Samsung Electronics, as strong AI spending signals extend the semiconductor rally.
🔥 Oil Climbs Above $109 as Hormuz Crisis Deepens
Brent crude rose 1.16% to $109.43, while WTI hit $102.90, as tensions in the Strait of Hormuz threaten a route that carries ~20% of global energy supply.
🛒 GameStop Launches $56B Bid for eBay
GameStop made a $125/share offer for eBay, sending eBay up 13% after-hours as it eyes a challenge to Amazon.
🌏 South Korea Stocks Hit Record Highs
The Kospi surged to fresh highs, extending April’s historic rally as investors balanced strong momentum with ongoing oil volatility.
🥇 Gold Slips Below $4,610 on Inflation Concerns
Gold edged down 0.2% to $4,606, pressured by inflation fears and uncertainty around U.S.-Iran talks, clouding the outlook for rate cuts.
🛢️ Oil Steadies as Traders Question U.S. Hormuz Plan
Crude held firm as markets weighed the feasibility of a U.S. plan to secure shipping routes through the Strait of Hormuz following a reported tanker attack.

Passing the Challenge Isn’t the Same as Trading Well
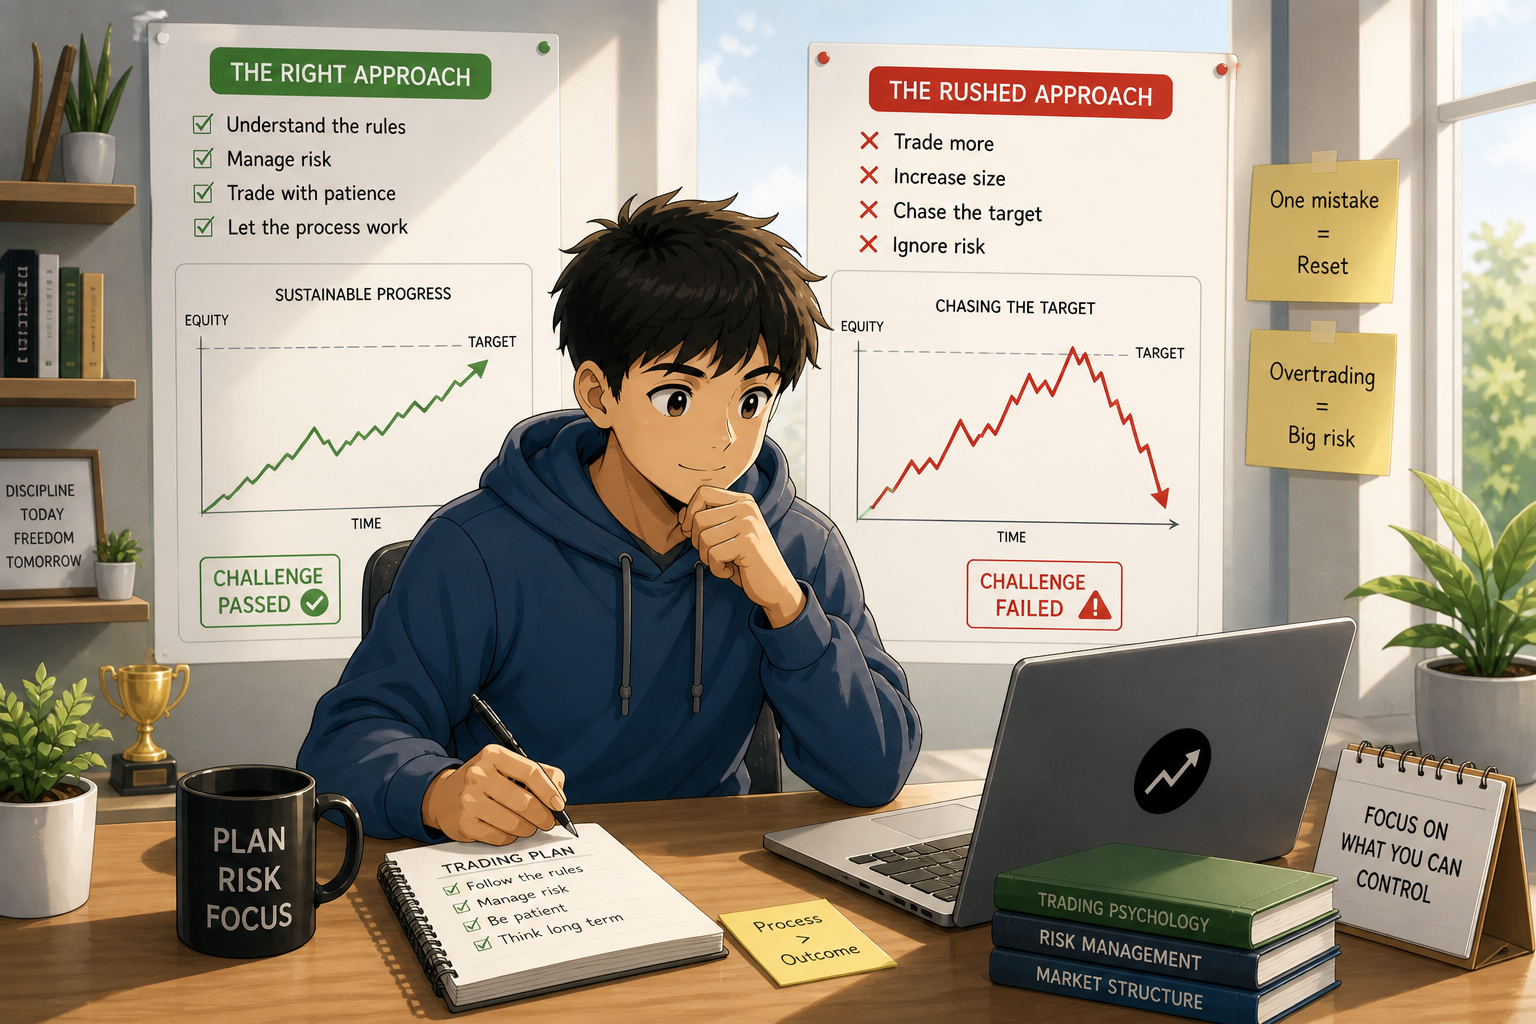
Prop firm challenges look simple on paper. Hit the target. Follow the rules. Get funded.
So you push.
You trade more. You increase size. You try to reach the goal quickly. It feels like progress.
That’s where the trap is.
The rules are tight. Drawdown limits. Daily loss caps. One mistake can reset everything.
Chasing the target often leads to overtrading and unnecessary risk.
You might pass fast… or fail faster.
Strong traders treat the evaluation like real trading.
They keep risk small.
They focus on clean setups.
They don’t rush the process just to hit a number.
Because the goal isn’t just to pass. It’s to stay consistent after.
When you trade the challenge with discipline, your decisions improve.
You build habits that actually last beyond the evaluation.
Some traders like learning how others approach funded accounts and manage strict rules.
If that’s you, you can explore a few market reads here:

Williams Accumulation/Distribution (WAD)
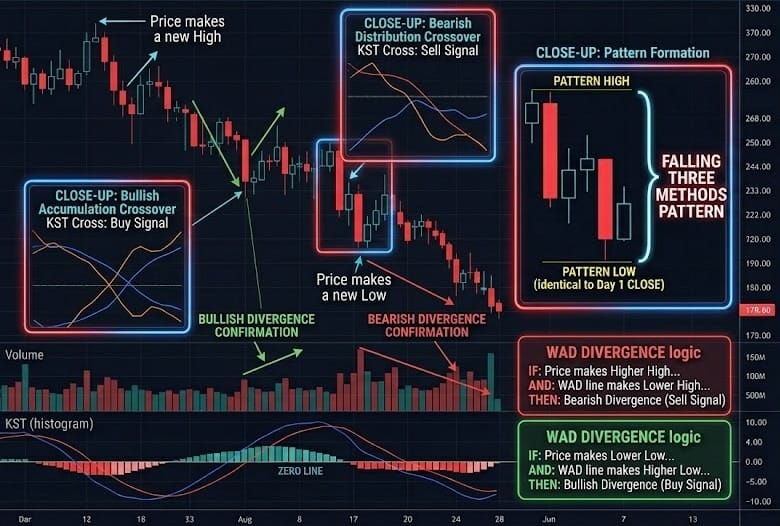
Developed by Larry Williams, the WAD indicator is a cumulative measure of price pressure. It differs from other A/D indicators because it ignores volume entirely, focusing instead on where the price closes relative to its "True Range" (the highs and lows of the current and previous sessions).
It is designed to show whether the "Smart Money" is quietly accumulating a position or offloading it (distributing) before the trend actually changes.
🛠️ The Strategy Logic
Use these logical triggers to spot "Hidden Divergence" between the price and the actual buying/selling pressure:
- IF: The price is making a new low, but the WAD line is making a higher low...
- THEN: You have Bullish Divergence. This is the classic Larry Williams "Buy" signal. It proves that even though the price is dropping, the internal buying pressure is actually rising. A sharp upward reversal is likely.
- THEN: You have Bullish Divergence. This is the classic Larry Williams "Buy" signal. It proves that even though the price is dropping, the internal buying pressure is actually rising. A sharp upward reversal is likely.
- IF: The price is making a new high, but the WAD line is making a lower high...
- THEN: You have Bearish Divergence. This indicates "Distribution." Large players are selling into the strength of the rally, and the price is likely to collapse once the "chasing" buyers are exhausted.
- THEN: You have Bearish Divergence. This indicates "Distribution." Large players are selling into the strength of the rally, and the price is likely to collapse once the "chasing" buyers are exhausted.
- IF: Both the price and the WAD line are moving in sync (making higher highs)...
- THEN: The trend is "Confirmed." This suggests the move is healthy and backed by real market pressure. You can stay in the trade with confidence.
- THEN: The trend is "Confirmed." This suggests the move is healthy and backed by real market pressure. You can stay in the trade with confidence.
- IF: The WAD line breaks above a previous peak while the price is still consolidating...
- THEN: An Upside Breakout is imminent. The WAD often "leads" the price; if the pressure breaks out first, the price almost always follows.
- THEN: An Upside Breakout is imminent. The WAD often "leads" the price; if the pressure breaks out first, the price almost always follows.
- IF: The WAD line starts to flatten or "hook" while the price continues to trend...
- THEN: Momentum is stalling. This is a "Warning" phase. While not an immediate exit signal, it suggests that the "easy money" part of the move is over.
💡 Pro Tip
The "True Range" Secret: Because WAD calculates based on the previous close, it is exceptionally good at identifying reversals in markets that "gap" often (like US Stocks).
If you see a gap down in price, but the WAD line actually moves up or stays flat, it’s a massive signal that the gap was a "bear trap."
Always look for WAD divergence at major support or resistance levels. If price hits support and WAD starts rising, the floor is likely solid.

You Think It Works… But You’ve Never Checked
You’ve been trading a setup for a while.
It feels solid.
You’ve had some good wins.You “understand” how it moves.You can explain it confidently.
So you believe you have an edge.
But if someone asked you:
Win rate?
Average R:R?
Max drawdown?
You’d guess.
THAT’S THE PROBLEM.
You’re trading on feeling, not evidence.
And feeling is unreliable.
A few big wins can trick your memory.
A couple clean trades can create confidence.
But that doesn’t mean the system actually works.
FEELING CONSISTENT ≠ BEING CONSISTENT.
This is how traders get stuck.
They trust the setup…But don’t trust it enough to size properly.
They hesitate on entries…Because deep down, there’s no real data backing it.
So execution becomes inconsistent.
Some trades you follow.
Some trades you skip.
Some you modify mid-way.
Because belief isn’t grounded.
It’s assumed.
AN EDGE YOU HAVEN’T MEASURED IS JUST A STORY.
Professionals don’t rely on memory.
They track.
Sample size.
Win/loss ratio.
Risk-to-reward.
Execution consistency.
Not to impress anyone.
To remove doubt.
Because when you know your numbers, decisions get easier.
You don’t panic after two losses.
You don’t hesitate on valid setups.
You don’t second-guess mid-trade.
You’ve seen it play out.
Over and over.
So here’s the shift:
Stop asking,
“Does this feel like it works?”
Start asking,
“Do I have enough data to prove it?”
Because the market doesn’t reward confidence.
It rewards tested conviction.