Bitcoin Crashes to $58K
....................................................................................................................


Good Morning,
Tech stocks are dragging the market down again, and a massive update from OpenAI is leaving investors frustrated.
We’re closing out a brutal week with another wave of red. Nasdaq futures are sinking 1.2% and the S&P 500 is down 0.5%, heading toward their fifth straight losing session. Only the Dow is managing to hold flat. The high-flying tech market is losing steam fast as expensive parts, delayed IPOs, and sticky inflation all slam the brakes on growth.
Apple is raising prices because tech parts are too expensive. There is growing fear that the booming cost of computer parts is going to hurt device makers. Apple (AAPL) just raised prices on its MacBooks and iPads to protect its profits, and Micron’s massive earnings report earlier this week confirmed that these chip shortages and price squeezes are going to stick around for a while.
The OpenAI IPO just got hit with a major delay. Adding to the tech gloom, a new report from The New York Times states that OpenAI is pushing back its highly anticipated mega-IPO until 2027. Investors who were hoping to cash in on the artificial intelligence pioneer anytime soon are pulling money out of the sector in frustration.
Inflation and shipping drama are keeping the Fed aggressive. It doesn’t help that the Fed's favorite inflation gauge, the PCE index, just came in hot for May. With inflation staying stubborn, bets are rising that the Federal Reserve will actually raise interest rates later this year. Plus, even though the U.S. and Iran have a temporary ceasefire, reports of fresh turmoil and confusion in the Strait of Hormuz shipping lane are keeping energy markets highly on edge.
It’s a rough Friday for tech bulls. The AI hype is facing a massive reality check, and Wall Street is heading into the weekend playing defense.

🛢️ Oil Slides 2% as Supply Outlook Dampens Renewed Strait of Hormuz Friction
Global energy prices declined on Friday morning, with international benchmark Brent crude falling toward its lowest level in four months at $74.10 a barrel. The market effectively shrugged off fresh Middle Eastern headlines—including a projectile striking a cargo ship off the coast of Oman and disputes over U.S.-Iran memorandum funds—as traders focused on expanding supply. Downward pressure was further intensified by Saudi Aramco resuming oil loading at its Ras Tanura terminal after a four-month halt and internal policy fissures that threaten the exit of Iraq, OPEC's second-largest producer.
🥇 Gold Stabilizes Near $4,000 an Ounce as Cool U.S. Inflation Eases Rate Concerns
Spot gold steadied near the $4,000 threshold on Friday, putting an end to a highly volatile trading week that saw bullion slide to its lowest technical level since November. The precious metal found solid ground after the latest U.S. inflation gauge came in softer than anticipated, effectively cooling market expectations for a near-term Federal Reserve interest rate hike.
🇰🇷 Samsung Readies Massive $648B Decade-Long Domestic Expansion Plan
Samsung Group is preparing to unveil a sweeping, trillion-won ($648 billion) investment pipeline intended to anchor South Korea's next macroeconomic growth cycle. The massive project includes a 300 trillion won push to construct advanced semiconductor factories in the nation's southwest region alongside heavy allocations for AI data centers, next-generation displays, and batteries, signaling a broader effort to decentralize the country's technology manufacturing footprint.
🤖 OpenAI Targets 2027 IPO Delay in Wake of SpaceX’s Volatile Nasdaq Debut
According to reports from The New York Times, OpenAI is actively reconsidering its original timeline to go public, leaning toward pushing its initial public offering back to 2027. The strategic pivot comes as executive leadership assesses the broader public market slowdown and a steep cooldown in Elon Musk’s SpaceX (SPCX) shares following its record-shattering public debut.
📱 Asia Shares Retreat as Aggressive Apple Price Hikes Spark Global Tech Friction
Exchanges across the Asia-Pacific region pulled back on Friday to cap off an otherwise stellar quarter. Market sentiment turned defensive after steep hardware price hikes from Apple revealed the immediate downstream cost penalty of booming global chip demand, overshadowing semiconductor expansion plans while the threat of Bank of Japan intervention kept the yen hovering just above 40-year lows.
₿ Bitcoin Crashes to $58,000 as Crypto Ecosystem Sheds $2.4 Trillion
Bitcoin tumbled below $58,000, extending its aggregate monthly loss to roughly 20% amid a sweeping contraction across decentralized digital assets. The broader cryptocurrency market capitalization has collapsed to $2.0 trillion from its $4.3 trillion peak in October, severely hitting corporate proxy equities like MicroStrategy, which sank to a two-year low on institutional concerns over its massive balance-sheet token exposure.
📉 Tumbling AI Hardware Stocks Trigger Extended Global Semiconductor Selloff
A severe global tech drawdown spread rapidly through international bourses as corporate buyers face soaring AI infrastructure costs. SoftBank Group plunged 13% in Tokyo to lead a bruising regional decline among hardware suppliers like Samsung and SK Hynix, a selloff that quickly bled into European semiconductor hubs and U.S. premarket software majors following aggressive end-user price increases from Apple and Microsoft.

The Loudest Voice Isn’t Always the Smartest
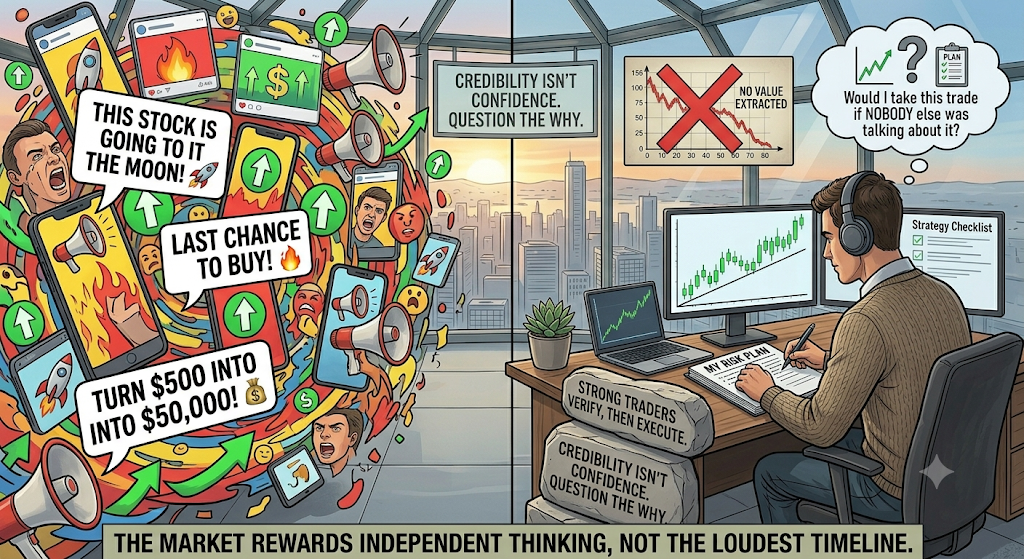
Open social media and you'll find someone calling the next big trade.
"This stock is going to the moon."
"This is your last chance to buy."
"Turn $500 into $50,000."
It's everywhere.
The problem isn't that people share ideas.
The problem is that many traders stop thinking for themselves.
They buy because someone sounded confident. They sell because a popular account turned bearish. Before long, their strategy becomes a collection of other people's opinions.
Strong traders don't confuse confidence with credibility. They listen, but they verify. They ask why a trade makes sense before risking money on it.
Because a good idea should still make sense even if nobody posted about it.
The market rewards independent thinking, not the loudest timeline.
The next time a trade starts trending online, pause before you click.
Ask yourself one question:
Would I still take this trade if nobody else was talking about it?
If the answer is no, you may be following the crowd instead of your plan.
Markets are full of different opinions. Reading a variety of thoughtful perspectives can help you separate signal from noise and sharpen your own thinking.
Explore a few market newsletters here:

Symmetrical Triangle
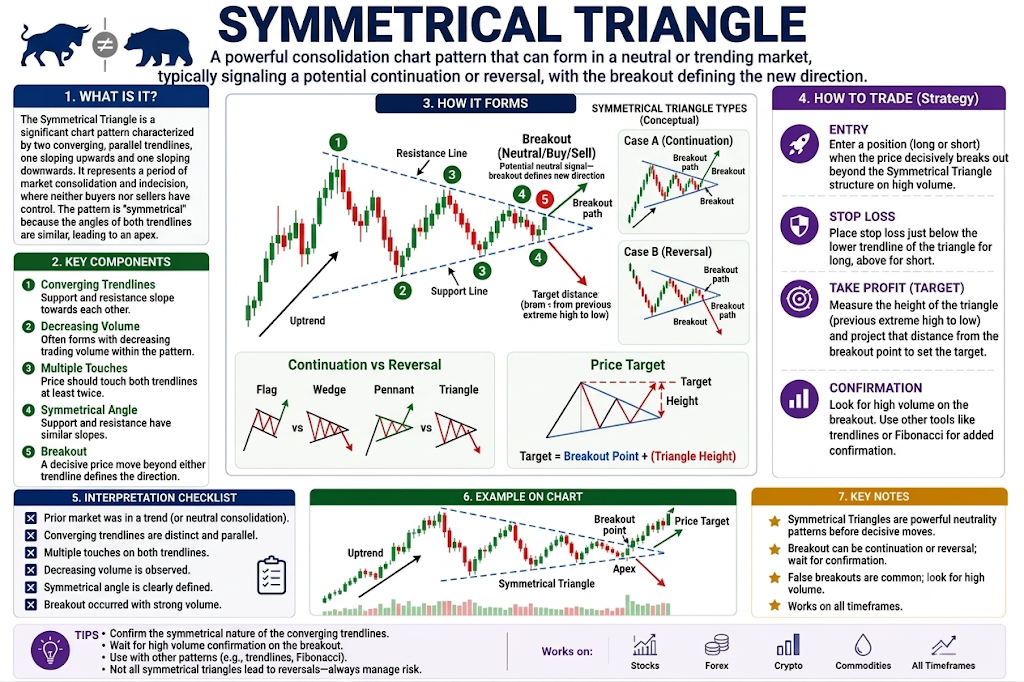
The Symmetrical Triangle is a chart pattern that represents a massive period of market hesitation. It forms when the price makes lower highs (sloping downward) and higher lows (sloping upward), drawing a perfect sideways funnel. It signals that buyers and sellers are evenly matched, compressing the price into a tight point before an explosive breakout occurs in either direction.
🔴 The Red Zone (The Descending Ceiling)
The Meaning: This is the upper boundary line connecting the lower highs. Every time the price tries to rally, the sellers step in earlier than before to block the move.
The Move: Wait. This line acts as a strict ceiling. Buying while the price is trapped underneath this line is highly risky, as the market hasn't chosen a direction yet.
🟡 The Yellow Zone (The Ultimate Squeeze)
The Meaning: The price bounces back and forth between the ceiling and the floor, but the space to move is rapidly running out. The swings get smaller and smaller.
The Move: Watch closely. The market is in total equilibrium—neither side is winning. The price is coiling up like a tight spring. This is the time to prepare your orders for whichever side breaks first.
🟢 The Green Zone (The Breakout Direction)
The Meaning: The price violently snaps out of the triangle, bursting through either the upper ceiling line or the lower floor line.
The Move: Go! Whichever way the price breaks out of the triangle is your green light. A clean break above the ceiling means buy; a clean break below the floor means sell or short.
🔍 Two Simple Signals to Watch
1. The Volume Dry-Up
Keep an eye on the trading volume bars as the price grinds deeper into the point of the triangle.
- The Logic: In a valid Symmetrical Triangle, volume should steadily shrink and get incredibly quiet, proving that both sides are waiting on the sidelines. The moment the breakout happens, a massive surge in volume is required to prove the move is real and backed by major institutions.
2. The Trend Baseline
Look at the direction the market was moving before the triangle started forming.
- The Logic: While a Symmetrical Triangle can break either way, it is statistically a continuation pattern. This means it most commonly breaks out in the same direction as the original trend that brought it there.
💡 The Simple Secret
Think of a Symmetrical Triangle as a coiled spring resting inside a box. The closer the price gets to the absolute tip (the apex), the more pressure builds up. To find your target after a breakout, measure the vertical distance of the widest part of the triangle (the base) where the pattern first started—the price will often run that exact same distance once it explodes out of the lines.

The Sunday Night Trading Genius
Sunday evening hits.
You're a different person.
Disciplined.
Reflective.
Practically enlightened.
You review your journal. Watch a few trading psychology videos. Read your notes from last week's mistakes.
Maybe you even write a page titled "Things I Will NEVER Do Again."
No revenge trading.
No moving stops.
No chasing breakouts.
No impulsive entries.
This week is going to be different.
You can feel it.
By Monday morning, you're calm. Focused. Ready.
By 10:18 AM, you've already taken a trade that wasn't in your plan.
By noon, you've added to a loser.
By the close, you're staring at your P&L wondering how the person who wrote those thoughtful Sunday notes disappeared so quickly.
Here's the uncomfortable truth: Most traders don't have a knowledge problem.
They have a transfer problem.
They understand their mistakes perfectly... after they happen.
They can explain why revenge trading is dangerous. They know why oversizing hurts performance. They can probably give a TED Talk on emotional discipline.
But awareness isn't the same as preparation.
Insight feels powerful because it gives us a sense of progress. It scratches that satisfying itch of self-improvement. You uncover a weakness, write about it, promise to fix it, and go to bed feeling productive.
But markets don't care what you realized on Sunday.
They care what you'll do when you're down 1R on Monday and a mediocre setup suddenly looks irresistible.
That's where most mindset work falls apart.
Because traders often focus on identifying bad habits instead of designing systems to interrupt them.
For example:
"Stop revenge trading" sounds good.
But what happens when you're angry?
What's the rule?
Close the platform for thirty minutes?
Maximum two trades after a loss?
Message an accountability partner?
Walk outside?
If there isn't a structure waiting for you at the moment of weakness, your old behavior usually wins.
Not because you're undisciplined.
Because habits love familiarity.
And they don't disappear just because you had a meaningful journaling session over the weekend.
Think about it this way.
Imagine trying to lose weight by reading nutrition books every Sunday, then keeping cookies on your desk Monday through Friday.
At some point, motivation runs out.
Environment and systems take over.
Trading is no different.
The goal isn't to become someone who understands their flaws better every weekend.
The goal is to become someone who has fewer opportunities to repeat them.
So next Sunday, instead of writing ten insights about your psychology, pick one recurring mistake.
Just one.
Then ask yourself:
"What specific rule or friction can I put in place so Future Me has a harder time making this mistake?"
Because insight feels good.
But structure changes behavior.
And in trading, behavior is what gets paid.