Apple Earnings Surge
....................................................................................................................


Good morning,
April went out with a bang, and the bulls are still running.
We’re opening May in "blue sky" territory. After a monster Thursday that saw the Dow rally nearly 790 points and the S&P 500 close above 7,200 for the first time ever, futures are still ticking higher this morning. It’s been a standout month; despite all the "war fog" and volatility, the S&P 500 just capped a 10.4% monthly rise—its best performance in over five years.
Apple is providing the "iBoost." The tech giant’s shares jumped roughly 2% in after-hours trading after crushing its fiscal Q2 report. Despite the backdrop of high memory-chip costs, Apple delivered $111.2 billion in revenue, driven by a massive 28% growth in Greater China and strong iPhone 17 sales. Between Apple’s resilience and the "Big Four" earnings we saw earlier this week, the AI-driven tech trade is proving it can handle the heat.
The "War Fog" has settled into a geopolitical "No Man's Land." While President Trump claims hostilities have "terminated," he’s doubling down on a total naval blockade of Iranian ports to force the Strait of Hormuz back open. Iran’s new leadership is pushing back, warning that the blockade will keep oil prices high. Brent crude is hovering around $111, nearly double pre-war levels, as traders realize that while the missiles have slowed down, the world's most important energy artery is still effectively a ghost town.
Energy and Healthcare take the stage this morning. Before the bell, we’re getting the "real world" pulse from Exxon Mobil, Chevron, and Moderna. Chevron is expected to show the bruising from downstream downtime, while Moderna is in the spotlight after launching a major mRNA bird flu vaccine trial. With U.S. GDP expanding at 2% and jobless claims at their lowest since 1969, the "Main Street" engine is still humming despite the triple-digit oil prices.
It’s a "victory lap" Friday.
We’re at all-time highs, the tech titans are delivering, and the U.S. economy is showing a layer of armor that most analysts didn't think was possible two months ago.

📱 Apple Tops Q2 Estimates on Resilient iPhone and China Sales
Apple shares rose after the tech giant posted a Q2 revenue beat of $111.2 billion and EPS of $2.01, surpassing the $1.96 analysts expected. iPhone revenue hit $56.99 billion, marking a second straight quarter of 20% growth in the segment as demand in China remained unexpectedly robust despite global macroeconomic headwinds.
💻 Intel Stock More Than Doubles in April for Best Month Ever
Intel shares soared 114% in April, the chipmaker's best monthly performance in its 55-year history. The massive rally, which saw Intel's market cap reclaim $470 billion, is fueled by a turnaround in its 18A chip manufacturing and a resurgence in CPU demand as AI developers pivot toward central processing units to solve infrastructure bottlenecks.
🛢️ Oil Rises as White House Sidesteps War Powers Deadline
Brent crude futures climbed to $111.63 after the Trump administration argued that the April 7 ceasefire "terminated" hostilities, effectively resetting the 60-day War Powers Resolution clock. The legal maneuver allows the White House to avoid seeking Congressional approval for the Iran conflict even as Brent briefly spiked to a four-year high of $126.
🌏 Asian Shares Gain in Thin May Day Trading
Markets across Asia trended higher on Friday despite many regional exchanges remaining closed for the May Day holiday. In Tokyo, the Nikkei 225 added 0.7% to finish at 59,678.31, buoyed by a stabilizing yen and a positive lead from Wall Street’s record-setting performance.
📊 Nasdaq Gains 15% in Best Monthly Showing Since 2020
The Nasdaq Composite closed out April with a 15.29% gain, its strongest month since the pandemic onset. The rally was underpinned by explosive earnings from Alphabet (+34% for the month) and Amazon (+27%), as investors piled back into tech leaders following a wave of revenue and cloud growth beats.
🌏 Nikkei and ASX 200 Climb Despite Weak GDP Data
Markets in Japan and Australia rose Friday, tracking Wall Street records while shrugging off a softer-than-expected 2% U.S. GDP growth rate. The Nikkei added 0.7% to finish near 59,678, supported by a strengthening yen after Japanese officials intervened to defend the currency from the 160-per-dollar level.
🥇 Gold Heads for Weekly Loss as Oil Fuels Inflation Fears
Spot gold held steady at $4,622 but remained on track for a 1.8% weekly decline as soaring energy costs clouded the interest rate outlook. With major central banks keeping rates on hold this week, global brokerages are scaling back expectations for 2026 rate cuts, citing persistent "sticky" inflation.

Leverage Makes Small Mistakes Expensive
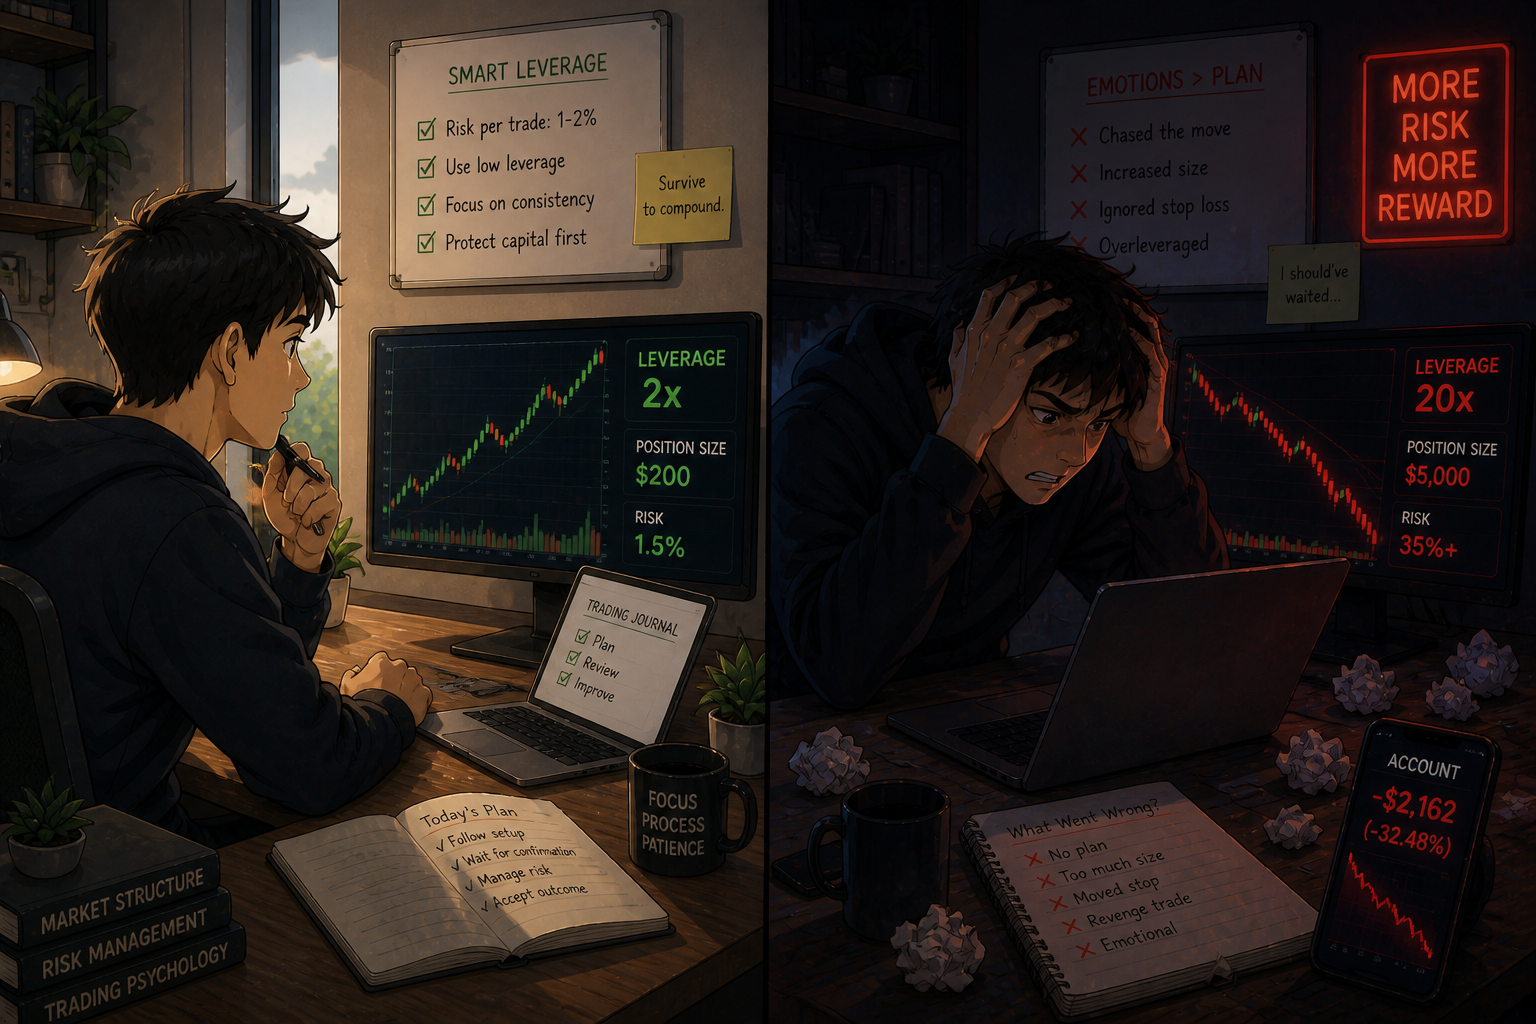
Leverage feels powerful. With a small account, it looks like the fastest way to grow.
So you increase your size. Just a bit more. Just to make the trade “worth it.”
That’s where the risk hides.
Leverage doesn’t just amplify profits. It amplifies mistakes. A normal move against you becomes a large loss. A small misread becomes costly. There’s less room to think, less room to manage.
What should be a manageable trade turns into pressure.
Strong traders treat leverage carefully. They keep position sizes controlled. They think about how much they can lose before thinking about how much they can make.
Because survival matters more than speed.
When you respect leverage, your account becomes more stable. You stay in control of your trades instead of reacting to them.
Control keeps you in the game.
Some traders like learning how to manage capital and build steadily without unnecessary risk.
If that’s you, you can explore a few market reads here:

Falling Three Methods
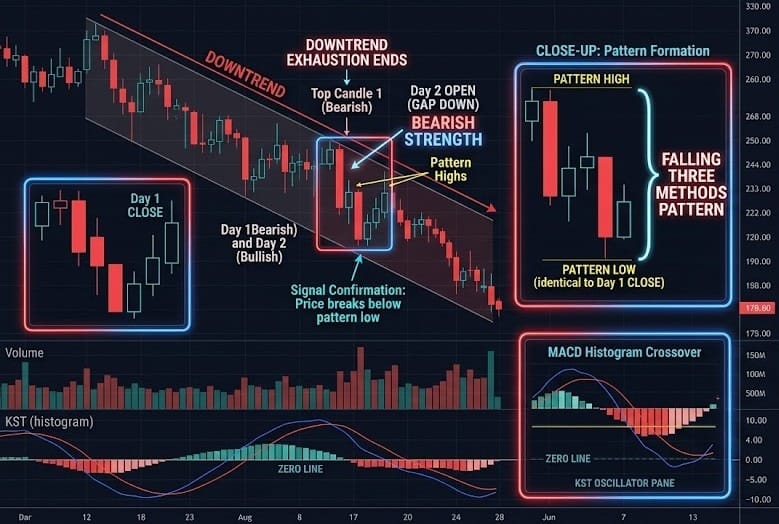
The Falling Three Methods is a five-candle bearish continuation pattern. It is the exact mirror image of the Rising Three Methods.
It signals that despite a minor "relief bounce," the sellers are still in full control and are just catching their breath before pushing the price lower. It visualizes a "Failed Recovery" within a dominant downtrend.
🛠️ The Strategy Logic
Use these logical triggers to identify when a small rally is actually a "Bear Flag" and a signal to sell:
- IF: A long red candle is followed by three small-bodied candles (usually green) sloping upward... * THEN: The market is in a "Rest" phase. This is not a reversal. As long as these three small candles stay inside the high and low of the first big red candle, the bearish trend is still technically in play.
- IF: The fifth candle opens near the close of the previous small candle and drops sharply...
- THEN: The "Supply" has returned. This indicates that the buyers from the previous three days have been exhausted and the bears are resuming their attack.
- THEN: The "Supply" has returned. This indicates that the buyers from the previous three days have been exhausted and the bears are resuming their attack.
- IF: The fifth candle closes below the low of the first long red candle...
- THEN: The pattern is Confirmed. This is a high-probability "Sell" or "Short" entry. It proves the bears have successfully defended the upper range of the first candle and are initiating a fresh leg down.
- THEN: The pattern is Confirmed. This is a high-probability "Sell" or "Short" entry. It proves the bears have successfully defended the upper range of the first candle and are initiating a fresh leg down.
- IF: The pattern forms just after a breakdown below a Keltner Channel or a major Support floor...
- THEN: This is a "Trend-Validation" signal. It confirms that the breakdown was real and that any "dip buyers" were quickly overwhelmed by the continuing trend.
- THEN: This is a "Trend-Validation" signal. It confirms that the breakdown was real and that any "dip buyers" were quickly overwhelmed by the continuing trend.
- IF: Volume is heavy on the first and fifth candles, but light on the middle three...
- THEN: The signal is high-conviction. Low volume on the "green" days proves that the rally was just a lack of sellers, not a surge of buyers, making the subsequent drop more reliable.
💡 Pro Tip
The "Ceiling" Secret: The first long red candle acts as a supply zone.
If the three small candles manage to close above the open of that first candle, the Falling Three Methods is invalidated and you should look for a potential "V-shaped" reversal instead. Always place your stop-loss just above the high of the first candle.
If the market is truly in a "Falling Method," it should never have the strength to break above that initial "Death Candle."

If It Looks Complicated, It Must Be Good… Right?
You load up your chart.
Trendlines.
Supply zones.
Demand zones.
Three indicators.
Maybe four.
It looks serious.
Like you’ve really done the work.
Then you see another setup.
Clean chart.
One level.
Clear structure.
And for some reason… you don’t trust it.
Feels too simple. Too easy.
So you go back to the busy chart.
COMPLEXITY FEELS LIKE CONFIRMATION.
That’s the bias.
The more you add, the more it feels like you’ve validated the trade.
More lines = more confidence.
More tools = more certainty.
But look closer.
Are those tools agreeing… or just overlapping?
Are you seeing clarity… or just stacking reasons until something sticks?
Because most of the time, you’re not improving the setup.
YOU’RE BUILDING A CASE FOR IT.
And that’s dangerous.
Clutter does two things:
It hides weak ideas.
And it slows down strong decisions.
Now you’ve got:
One indicator slightly bullish.
Another slightly bearish.
Price sitting between three zones.
So what do you do?
You hesitate… or force it anyway.
Either way, it’s messy.
BUSY CHARTS CREATE BUSY THINKING.
Clean charts do the opposite.
They expose the truth.
Level holds — or it doesn’t.
Structure breaks — or it doesn’t.
No hiding.
And that’s why they feel uncomfortable.
Because there’s nothing to lean on except your judgment.
No extra “backup.”
No layers of reassurance.
Just a decision.
Let’s be real:
A lot of traders don’t add tools to improve accuracy.
They add them to reduce doubt.
But doubt doesn’t disappear with more indicators.
It disappears with clear rules and repetition.
So here’s the shift:
If you need five tools to convince yourself to take a trade…
You probably shouldn’t take it.
Because the best setups don’t need to be proven over and over.
They’re obvious — if you’re willing to keep things simple.